Tag Archives: fn-start

I Like The Risk Level On The PowerShares S&P 500 Low Volatility Portfolio ETF SPLV, But The Expense Ratio Is Only Mediocre

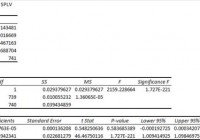
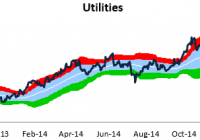
Summary I’m taking a look at SPLV as a candidate for inclusion in my ETF portfolio. I’m not huge on the expense ratio, but I like the other aspects of the ETF. The ETF is incredibly well diversified which is favorably impact the standard deviation of returns. In the context of Modern Portfolio the correlation and standard deviation of returns are very important. The ETF looks favorable in those regards. I’m not assessing any tax impacts. Investors should check their own situation for tax exposure. Investors should be seeking to improve their risk adjusted returns. I’m a big fan of using ETFs to achieve the risk adjusted returns relative to the portfolios that a normal investor can generate for themselves after trading costs. I’m working on building a new portfolio and I’m going to be analyzing several of the ETFs that I am considering for my personal portfolio. One of the funds that I’m considering is the PowerShares S&P 500 Low Volatility Portfolio (NYSEARCA: SPLV ). I’ll be performing a substantial portion of my analysis along the lines of modern portfolio theory, so my goal is to find ways to minimize costs while achieving diversification to reduce my risk level. What does SPLV do? SPLV attempts to track the total return of the S&P 500® Low Volatility Index. At least 90% of funds are invested in companies that are part of the index. SPLV falls under the category of “Large Value”. Does SPLV provide diversification benefits to a portfolio? Each investor may hold a different portfolio, but I use (NYSEARCA: SPY ) as the basis for my analysis. I believe SPY, or another large cap U.S. fund with similar properties, represents the reasonable first step for many investors designing an ETF portfolio. Therefore, I start my diversification analysis by seeing how it works with SPY. I start with an ANOVA table: (click to enlarge) The correlation is about 74.5%. This is pretty great for making the ETF fit under modern portfolio theory. The low correlation means it should be possible to use the ETF without raising the standard deviation of returns unless the risk ETF has a very high standard of deviation of returns. Standard deviation of daily returns (dividend adjusted, measured since January 2012) The standard deviation is phenomenal. For SPLV it is .5978%. For SPY, it is 0.7300% for the same period. SPY usually beats other ETFs in this regard, so the combination of relatively low correlation and lower standard deviation than SPY is giving this ETF a real chance at being selected for my portfolio. Mixing it with SPY I also run comparisons on the standard deviation of daily returns for the portfolio assuming that the portfolio is combined with the S&P 500. For research, I assume daily rebalancing because it dramatically simplifies the math. With a 50/50 weighting in a portfolio holding only SPY and SPLV, the standard deviation of daily returns across the entire portfolio is 0.6410%. If we drop the position to 20% the standard deviation goes to .6899%. Once we drop it down to a 5% position the standard deviation is .7195%. I haven’t decided what exposure level I would use yet, but probably 5% to 10%. I really like the combination of low volatility and moderate to low correlation. If it wasn’t for the higher expense ratio, I’d consider making this a core holding. Why I use standard deviation of daily returns I don’t believe historical returns have predictive power for future returns, but I do believe historical values for standard deviations of returns relative to other ETFs have some predictive power on future risks and correlations. Yield & Taxes The distribution yield is 2.21%. The yield seems strong enough that it could be included in a retirees portfolio to bring some diversification benefits and a moderate dividend yield. I’m not a CPA or CFP, so I’m not assessing any tax impacts. If I were using SPLV, I would want it to be in a tax exempt account to remove any headaches associated with frequent rebalancing. Expense Ratio The ETF is posting .25% for an expense ratio. I want diversification, I want stability, and I don’t want to pay for them. In my opinion, a .25% expense ratio is higher than I want to pay for equity investments. It’s still low relative to many other methods of investing, but I’m looking for long term holdings and I don’t want to give my investments away. I haven’t decided if it’s worth paying the higher expense ratio to include SPLV. If the expense ratio was under .10%, this ETF would have a very strong case for being included. Market to NAV The ETF is at a .05% premium to NAV currently. In my opinion, that’s not worth worrying about. It is practically trading right on top of NAV. However, premiums or discounts to NAV can change very quickly so investors should check prior to putting in an order. Largest Holdings The portfolio is extremely well diversified. The largest position is around 1.25% of the portfolio. That is solid diversification. The intense diversification is part of the reason the volatility of the ETF is so low. Check out the chart below: (click to enlarge) Conclusion I’m currently screening a large volume of ETFs for my own portfolio. The portfolio I’m building is through Schwab, so I’m able to trade SPLV with no commissions. I have a strong preference for researching ETFs that are free to trade in my account, so most of my research will be on ETFs that fall under the “ETF OneSource” program. SPLV is a difficult ETF to make a decision on. For equity investments, the expense ratio is a bit high, but the relatively low correlation and standard deviation of returns make a pretty good argument for using at least a small position such as 5% in a long term portfolio. I could go either way on this one. I won’t consider it as a core holding (20%+) because of the higher expense ratio.

Under The Hood Of SPDR Barclays High Yield Bond ETF

By John Gabriel For strategic, long-term exposure to U.S. high-yield bonds, investors may consider SPDR Barclays High Yield Bond ETF (NYSEARCA: JNK ) as a small core holding. The fund can also serve as a tactical investment for the satellite portion of a diversified portfolio. Investors should bear in mind that high-yield bonds are one of the most volatile sectors of the fixed-income market. Long-term-minded investors looking to JNK as a strategic position are likely to find the diversification benefits of high-yield bonds attractive. High-yield bonds tend to be negatively correlated (or uncorrelated) with government and aggregate bond portfolios, which often make up the bulk of most investors’ fixed-income exposure. Moreover, high-yield bonds are poised to hold up relatively well in the event of rising interest rates and inflation. While rising rates and inflation tend to be the enemy of typical fixed-income securities, the high-yield bond asset class tends to outperform its fixed-income peers during such periods thanks to its stocklike returns and heavier dependence on business fundamentals. Consider that over the past 10 years, U.S. high-yield bonds have shown positive correlation (74%) with the S&P 500, while the Barclays U.S. Aggregate Bond Index has been relatively uncorrelated (26%) over the same period. Remember, interest rates will typically rise when the economy is in good shape and businesses are performing well. High-yield bonds tend to perform well when issuers’ fundamentals are strong or improving (and vice versa). Tactical investors may look to a fund like JNK as a way to bolster income in a yield-starved environment. However, investors should not look at the fund’s yield in isolation. Rather, the current yield should be viewed in relation to the yield offered by U.S. Treasuries with the same maturity. The difference between the two is what is known as the credit spread, and it represents the premium that investors can collect for assuming additional credit risk. The credit spread should also be viewed relative to the expected default rate. According to Moody’s, since 1983 the historical average default rate for high-yield bonds is 4.8%. In the trailing 12-month period through October 2014, the U.S. high-yield default rate was 2.4%, relatively flat from a year ago. Rising default rates typically result in widening credit spreads. But default rates are expected to remain low (around 2%) thanks to favorable credit conditions. Fundamental View The U.S. high-yield bond market has evolved over the past few decades. Whereas in the 1970s the overwhelming majority of high-yield bonds were so-called “fallen angels” (bonds issued by companies that had their credit ratings downgraded from investment-grade to high-yield status), today there is a vibrant and healthy market for new-issue high-yield bonds. According to SIFMA, in 2014, new issuance of high-yield bonds in the United States was $278 billion through October, slightly below the $285 billion sold in 2013 in the same period. By comparison, high-yield issuance averaged $95 billion per year from 1999 to 2009. Many investors may find the significant income potential of U.S. high-yield bonds attractive, particularly in the current low-yield environment. Their income potential is a primary point of appeal that attracts investors to the high-yield corporate-bond market. Indeed, there are very few other investments that offer high- to mid-single-digit yield potential in the current market environment. But other factors to consider include the asset class’ diversification benefits as well as its ability to withstand the impact of rising interest rates, potential inflation, and an uptick in the instance of default. U.S. high-yield bonds offer a favorable risk/reward profile relative to other major asset classes thanks to their equitylike returns with significantly less volatility. Owing to its generous yield, the Bank of America Merrill Lynch High Yield Master II Index (the generally accepted benchmark for the asset class) generated an annualized total return of 7.6% over the past 15 years. This compares to a total return of about 4.6% for the S&P 500. But the BofAML HY Master II Index’s annual standard deviation over that period was 9.9%, compared with 15.3% for the S&P 500. Adding a stake in high-yield bonds to complement aggregate bond exposure can help improve a portfolio’s diversification benefits. In fact, over the past five years, high-yield bonds have been uncorrelated (12%) with the Barclays U.S. Aggregate Bond Index. The asset class’s lack of correlation with investment-grade bonds and its negative correlation with government bonds should be an advantage when we finally see the inevitable rise in interest rates and potentially higher inflation. Of course, these advantages don’t come without risk. This economically sensitive asset class fell more than 32% in 2008 when the markets were roiled by the global credit crisis. Steady inflows from yield-starved investors have helped drive prices higher. The current option-adjusted credit spread between the BofAML HY Master II Index and U.S. Treasuries is about 4.4%. For some context, consider that the long-term average credit spread is about 6%. The all-time low of around 2.5% occurred in June 2007, while the all-time high occurred in December 2008 at the height of the credit crisis when the spread briefly spiked up to more than 20%. Fitch expects U.S. high-yield default rates will remain low through 2015 thanks to accommodative funding conditions and a recovering economy. Moreover, many of the highest risk issuers have taken advantage of favorable credit markets in recent years to extend their lifelines. Portfolio Construction This fund seeks to provide investment results that, before fees and expenses, correspond generally to the price and yield performance of the Barclays Capital High Yield Very Liquid Index. The index includes publicly issued U.S. dollar-denominated, non-investment-grade, fixed-rate, taxable corporate bonds that have a remaining maturity of at least one year. The fund uses a representative sampling strategy to track the index and currently has nearly 800 holdings. Its sector exposure is extremely concentrated, as industrials make up 89% of the portfolio. The financials sector makes up roughly 8%, while utilities round out the portfolio at about 4% of the benchmark. Issues rated BB and B make up 40% and 43% of the index, respectively. The remaining 17% is made up of issues rated CCC or lower. Currently, the fund’s modified adjusted duration is 4.38 years, and its weighted average yield to maturity is 6.39%. Fees This fund charges an expense ratio of 0.40% per annum. While this is quite a bit higher than those levied by funds tracking an aggregate bond index, it is cheap compared with actively managed funds in the same category. High-yield bonds tend to be more illiquid than investment-grade corporate bonds, which can make them comparatively expensive to trade. With an estimated holding cost of 0.72%, JNK reflects the challenges of employing a sampling strategy to track a relatively illiquid benchmark. Transaction costs explain the difference between the fund’s expense ratio and its estimated holding cost. Alternatives The closest alternative to JNK is iShares iBoxx $ High Yield Corporate Bond (NYSEARCA: HYG ) , which has a slightly higher expense ratio of 0.50% but a lower estimated holding cost of just 0.18%. HYG tracks the Markit iBoxx USD Liquid High Yield Index and also employs a representative sampling strategy. It currently has nearly 900 holdings and is much more diversified than JNK in terms of sector exposure. At 4.12 years, it has a slightly shorter duration than JNK. It also has a lower average yield to maturity of 5.59%. Another alternative for investors to consider is PowerShares Fundamental High Yield Corporate Bond ETF (NYSEARCA: PHB ) , which charges a 0.50% expense ratio. PHB seeks to outperform its cap-weighted peers by tracking a fundamental index developed by Research Affiliates, LLC. Investors concerned about the health of the economy and future default rates may favor PowerShares’ PHB, as its benchmark avoids the riskiest issuers (excludes issues rated below B). PHB has a comparable duration of 4.37 years, and its higher-quality portfolio offers a slightly lower yield to maturity of 5.05%. Investors concerned about the impact of rising interest rates may consider SPDR Barclays Short Term High Yield Bond ETF (NYSEARCA: SJNK ) or PIMCO 0-5 Year High Yield Corporate Bond ETF (NYSEARCA: HYS ) , which charge expense ratios of 0.40% and 0.55%, respectively. SJNK currently has a modified duration of 2.4 years, and its yield to maturity is 6.41%. HYS has a slightly lower duration of 1.96 years and currently offers an estimated yield to maturity of 5.47%. Disclosure: Morningstar, Inc. licenses its indexes to institutions for a variety of reasons, including the creation of investment products and the benchmarking of existing products. When licensing indexes for the creation or benchmarking of investment products, Morningstar receives fees that are mainly based on fund assets under management. As of Sept. 30, 2012, AlphaPro Management, BlackRock Asset Management, First Asset, First Trust, Invesco, Merrill Lynch, Northern Trust, Nuveen, and Van Eck license one or more Morningstar indexes for this purpose. These investment products are not sponsored, issued, marketed, or sold by Morningstar. Morningstar does not make any representation regarding the advisability of investing in any investment product based on or benchmarked against a Morningstar index.

Utilities: The High-Flyers Of 2014

The S&P 500 Utilities sector is closing out 2014 with a bang. As shown below, the sector is currently in the midst of another big momentum move higher into extreme overbought territory – currently trading more than two standard deviations above its 50-day moving average. The sector is up a whopping 28% year-to-date – easily the top performing sector of 2014. No wonder so many portfolio managers are underperforming this year. Utilities – the most defensive, low-growth sector of the market – has been leading the way. It’s tough to sell investors on a big overweight position in utilities, especially in a rising rate (at least those are the expectations) environment. But if you haven’t owned utilities, chances are you’ve lost ground to the S&P this year. After this recent move into the stratosphere, the P/E ratio for the utilities sector has jumped up to 18.77. That’s high, especially in relation to the P/E ratio of the S&P 500 as a whole. At 18.77, the P/E for utilities is actually 0.27 points higher than the P/E for the S&P 500 (18.50). Now that you’ve read this, are you Bullish or Bearish on ? Bullish Bearish Sentiment on ( ) Thanks for sharing your thoughts. Why are you ? Submit & View Results Skip to results » Share this article with a colleague