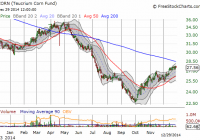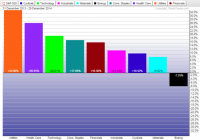
Summary The yield curve flattened in 2014 as short-term rates increased and long-term rates declined. Utilities benefited from lower long-term rates and is set to finish the year as the best performing sector. The U.S. dollar rally in 2014 looks like the early stage of a much larger rally. One of the biggest trends in 2014, for both length of time and the size of the move, was the bull market in long-term government bonds. The 30-year U.S. Treasury bond will finish the year near its highest level in decades. The 10-year treasury yield of nearly 2.2 percent is off the lows set in 2012, but near the levels reached at the depth of the 2008 financial crisis. There may even be room to move lower because that yield looks plentiful next to German and Japanese 10-year government bonds, which yield a paltry 0.55 percent and 0.33 percent, respectively. Investors who purchased iShares Barclays 20+ Year Treasury (NYSEARCA: TLT ) at the start of the year would be sitting on gains of more than 26 percent as of December 29. That is competitive with the best performing S&P 500 sectors in 2014 and gives it a better than 10 percent lead on both the S&P 500 Index and the Nasdaq this year. As for those best performing sectors, utilities and healthcare are set to grab the top two spots. (click to enlarge) In the currency market, a bull rally in the U.S. dollar kicked off in mid-summer against the yen and euro, and this extended to emerging market currencies by the start of autumn. The U.S. dollar heads into 2015 in a widespread bull market against all major currencies, with even the Chinese yuan showing signs of weakness. A Look Back At Interest Rates In 2014 This year started with investors expecting a rise in interest rates after the Federal Reserve began tapering its asset purchases in December 2013. The Fed ended its third round of quantitative easing (QE3) in October, but history proved superior to expectations: each time the Federal Reserve has exited quantitative easing, interest rates moved lower, not higher, and this time was no different. Rates peaked at the start of the year and never looked back, beginning an almost uninterrupted slide that has yet to finish. (click to enlarge) Economic growth failed to spur general rate increases. GDP growth dipped in the first quarter, then picked up strongly in the subsequent quarters, eventually climbing to 5.0 percent annualized growth in the third quarter. Despite these robust growth numbers, long-term bonds will close out 2014 at or near their highs for the year. Interest rates didn’t fall across the board though. The 2-year treasury yield has been rising since the Federal Reserve announced the taper in May 2013. The 5-year treasury yield didn’t gain in 2014, but it didn’t fall either. (click to enlarge) (click to enlarge) Rising short-term rates and stable or falling long-term interest rates makes for a flatter yield curve. A flat yield curve usually occurs in the middle of an economic expansion, when the economy is firing on all cylinders. Sector Performance Utilities and healthcare are the best performing S&P 500 sectors by a wide margin in 2014. Utilities last delivered a sector topping performance in 2011, when long-term interest rates sank to their lowest point in decades and stocks generally struggled-the S&P 500 Index gained only 2.1 percent that year. Going back further, utilities topped the list of S&P 500 sectors in 2006 as well. Investors with good memories will remember many early recession calls at that time due to a flat yield curve. Healthcare and utilities get lumped in with consumer staples as “defensive” sectors, but the strength seen in these sectors doesn’t indicate a weak market ahead. Healthcare has benefited mightily from the performance of the non-defensive biotechnology sector. SPDR Biotechnology (NYSEARCA: XBI ) is up more than 44 percent this year, for example, well ahead of the healthcare sector. If investors were looking for defensive plays, the sector would be led by pharmaceuticals or healthcare providers rather than biotechnology. Utilities are generally a conservative choice for investors, but the utilities sector was in a downtrend from 2009 to 2014. Working in the sector’s favor is a strong economy and lack of exposure to foreign markets. (click to enlarge) Currency Markets The U.S. Dollar Index broke out to a multi-year high in 2014 and will finish the year near its highs. The greenback was aided by six factors. First, the Federal Reserve tightened monetary policy with its exit from QE. Second, the European Central Bank is moving towards loosening monetary policy with its own version quantitative easing. Third, the Bank of Japan did a surprise expansion of QE on Halloween. Fourth, the collapse in oil prices dragged emerging market currencies lower. Fifth, China’s rebalancing has weakened emerging markets by reducing commodities demand. Sixth, the U.S. economy is among the strongest of the developed economies. The chart below is a price ratio of PowerShares DB U.S. Dollar Index Bullish Fund (NYSEARCA: UUP ) versus SPDR S&P 500 (NYSEARCA: SPY ). It shows that since July, investors could have earned more by investing in the U.S. dollar (going short a basket of foreign currencies that make up the dollar index) than from stocks. This is surprising for a bullish phase of the market-since 2008, U.S. dollar rallies have typically come along with stock market corrections. (click to enlarge) There is a lot of positive sentiment around the U.S. dollar, but structurally the global economy is still short the U.S. dollar. Well into 2014, for instance, Chinese property developers were borrowing in U.S. dollars . An extended U.S. dollar rally could be the only fuel needed for an even bigger and longer U.S. dollar rally if borrowers in emerging markets are forced to hedge their dollar exposure or repay debt. Rising interest rates in the United States, a bias towards rate cuts in China, plus easy money in Europe and Japan, puts the greenback in a strong position in 2015. What It All Says for 2015 Although sector performance in 2014 flashes a caution light, the yield curve is flattening, not flat. The yield curve would need to flatten much more before it would signal a possible recession, but the Federal Reserve isn’t going to raise rates enough to flatten out the yield curve in 2015. The U.S. economy continues to expand and the political situation is favorable for stocks. The Republican Congress and President Obama are unlikely to agree on much, but they do agree on trade deals and possibly even some tax reform. If the U.S. dollar rally continues into 2015, the macro environment will bear a striking similarity to the late 1990s. A continued rise in short-term interest rates is coming, at least until the Federal Reserve signals otherwise. It remains to be seen how long-term interest rates behave, but they could remain low whether short-term rates rise or fall. Far lower interest rates in Europe and Japan, in addition to the rising U.S. dollar, could keep a lid on interest rates if foreigners move capital into the U.S. bond market. Weakness in high yield debt, the fallout from low oil prices, will also work in favor of government bonds. Among S&P 500 sectors, utilities are most affected by the 10-year interest rates. This chart shows the 10-year treasury bond yield versus the price ratio of SPDR S&P 500 and SPDR Utilities (NYSEARCA: XLU ). The falling black line indicates XLU beating SPY, which has occurred for most of 2014 as interest rates declined. Utilities are unlikely to lead again in 2015, but as long as the rate environment isn’t a drag on returns, the strong economy and relatively high yield of the sector could keep it among the better performing sectors next year. (click to enlarge) If both short-term and long-term interest rates increase, the sector that stands to benefit the most is financials. Any broad ETF such as iShares US Financials (NYSEARCA: IYF ) or SPDR Financials (NYSEARCA: XLF ) delivers good exposure. The strong dollar and strong economy work in its favor, and if the dollar rally is a major trend in 2015, financials will benefit as foreign capital flows into the U.S. through American financial institutions. Under performing sectors such as energy and materials could rebound in 2015 after a dismal 2014, but if the global economy doesn’t pick up, a rally could be short lived. A major issue that could affect healthcare stocks in 2015 is the Supreme Court ruling on Affordable Care Act subsidies. The law as written does not allow subsidies for states without exchanges and if the Supreme Court were to rule against them, the history of the Obama Administration’s handling of the law suggests a period of confusion will follow. A Republican Congress doesn’t make the administration’s job any easier – if a fix requires Congressional approval, they may not get it. Finally, an important test for the euro will come in January. The European Central Bank meets in January and Greece’s election is at the end of the month. Sentiment is negative right now because the market expects the ECB to implement some type of QE policy and Greece to elect an anti-austerity government. If one or both of those things don’t occur, the U.S. Dollar Index, which has nearly 58 percent of its basket in the euro, could run out of steam at least temporarily. Barring such an outcome, the strong U.S. dollar will continue to weigh on stocks denominated in foreign currency. A QE policy in Europe would likely boost equity markets though, so funds that hedge away currency exposure, such as WisdomTree Europe Hedged Equity (NYSEARCA: HEDJ ), will do better than their unhedged competition.