Tag Archives: fn-start

Valuation Challenges When PEs Are Expanding: 2 Examples

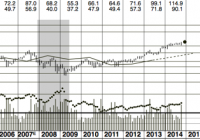
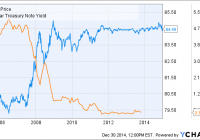
One hallmark of this secular bull market is expanding PE/cash flow multiples. Thus valuations based upon recent historical multiples can be deceiving. I give an example from one stock and one broad ETF. Everyone knows we have been in a cyclical bull market since the spring of 2009. I have argued elsewhere we are now in the early stages of a secular bull market that should continue well into the next decade. One argument supporting this view is to point out that the PE compression which characterized the earlier years of the 21st century has ceased. I shall illustrate this with a few charts shortly. Why is this important to investors? Many analysts judge the attractiveness of the market or a particular stock by comparing PE multiples (or cash flow multiples) with traditional and recent (say, the past decade) multiples. A stock selling at 45x earnings when historically it commanded a multiple closer to 18x is likely to be overvalued and less attractive as an investment or source of dividend income. If we are in a period of rising multiples, however, comparing current PEs to those of the past few years may make companies appear overvalued, when in fact they remain attractive investments going into a brighter future. We can use Teleflex (NYSE: TFX ) as an example. The Value Line chart below shows that TFX traditionally has commanded a cash flow multiple of 10.5x. Well above this (e.g. 2007) was an attractive time to sell, below it (e.g. 2003 and certainly 2009) were great entry points. What should we make of the current multiple, which is closer to 20x cash flow? (click to enlarge) source: Value Line The quick conclusion is that TFX is overvalued and buyers should not pull the trigger. But what if we are in a period of rising multiples, for reasons i made clear yesterday ( here )? This is even more likely given that medical technology is an emerging super field and has been a market leader for several years now. Combining fundamental analysis with charts and some technical snooping might shed more light, and useful trading information, on this challenge. The chart below shows that TFX has been in a bull market since 2009 and ascending in a broad channel as shown in white. If you look at the white channel, TFX touched the upper boundary (it was “overvalued”) in April of this year. But instead of selling off and churning like it did for almost two years back in 2010, the shares have worked their way higher. Maybe we should assume the price range is better defined by the red channel now. Oddly enough, that also suggests it is now fully valued. But the point where a prospective buyer might want to reacquire the shares is quite different. If the higher evaluation (red channel) mode is now in force, that price is approaching $100 as the new year unfolds. Using the old valuation channel, a buyer wouldn’t be interested until the price falls well into the $70s. This might be mere curve fitting but for the fact that broad indexes and ETFs such as the S&P500 Trust (NYSEARCA: SPY ) show almost exactly the same phenomenon. Compare the white and red channels in SPY below. (click to enlarge) source: freestockcharts.com Is this new channel reflective of higher valuations? Yes: (click to enlarge) source: etrade . While some expansion might have occurred in the early years of the bull market because earnings (the denominator in PE) are lagging indicators, it certainly is not the case now: corporate earnings growth is strong. And likely to get stronger! Already third quarter GDP growth came in at 5%, and second quarter GDP was revised higher. The full effect of lower oil prices still has to fully work into the economy, and the fiscal prudence of a Republican House (and now Senate) seems destined to continue. While it may be an ad hoc/seat of the pants process, investors would be well advised to revise their tolerable PE/cash flow multiples on stocks higher in the next few years. Get ready to buy Teleflex shares if a correction brings prices back to the high nineties.

Why I’m Margin SHY

Summary Margin interest rates at major brokers are several percent. One could instead short SHY at the cost of one half a percent. Tail-risk could make this dangerous. ETF Description SHY is the short-duration treasury ETF managed by iShares. It holds treasuries with a duration between 1 and 3 years. It currently yields 0.46%. It effectively mirrors the behavior of the two year yield. SHY data by YCharts Thesis Below is a table taken from Tradeking of current margin rates at major brokers: One could save substantially by instead shorting SHY. For a hypothetical portfolio which has two dollars of equity for each dollar of margin the current interest charge might be 8%. By lowering that to 0.5% by shorting $1 of SHY for each two dollars of equity, our hypothetical portfolio would perform 3.75% better (on equity). Maintaining this level of out-performance would result in having twice as much money over twenty years! One may also benefit from capital gains because short term yields seem, on balance, more likely to rise than fall over the next ten years or so. Investment Risks Is this a free lunch? I’m honestly not quite certain. On May 6th, 2010 the Dow Jones Industrial average dropped 9% and recovered over the course of minutes. Some stocks, like Procter & Gamble, traded down to a penny. If for some reason there was a flash spike in the value of SHY and your broker forced liquidation, you could be wiped out. It’s hard to quantify the likelihood of such a situation. This is in general a problem of using margin, as a flash crash could wipe you out if your broker forced you to sell at pennies. One might be inclined to think that the risk could be decreased by using multiple short-duration treasury ETFs. This is not the case. It simply adds more danger, because any one of them could theoretically trade at an insane level. The fact that each ETF would represent a smaller amount of money doesn’t help, because it only takes one share trading for $100,000 (as some stocks did during the flash crash) to wipe you out. An important question to ask your broker is what they would do in such a situation. Second, if short-term yields declined further the value of SHY could increase. Suppose that short term interest rates went to negative 3% overnight. If the average duration is roughly two years so if the ETF reflects net asset value the value should increase to something like 6% above par. This would translate to a 6% increase in the ETF’s value. This might be scary if it happens overnight but isn’t much larger than you might have paid for interest over the course of the year. Much larger negative interest rates could cause more significant losses. If we saw short term interest rates go to negative 30% the Net Asset Value of the fund would double. If your broker forces you to sell at that point your losses could be substantial. Third, a deflationary environment might cause a similar problem. The value of short term treasuries might spike. To get a substantial loss (eg. 50%) we’d still need to see something like 17% deflation or 17% negative interest rates. Fourth, if your stock portfolio drops in value you might be forced to sell some positions at depressed values to cover your short position. This is more likely than when using margin! Take the time to calculate how much margin or short SHY you should use under different scenarios. You should at least assume that at some point the US stock market will fall 50%. If it does what will happen to your portfolio? If you are using one dollar of margin per dollar of equity then you are wiped out. Similarly, if you are short one dollar of SHY per dollar of equity you are also wiped out. You might be inclined at this point to say, well alright, I’ll just make sure that my margin/SHY is 49% of the value of my stocks. If this happens, your broker is still likely to force a sale at depressed levels, which could leave you with as little as 2% of your original portfolio value. You need to check what the maintenance requirement for margin is with your broker. For example, at Tradeking the maintenance requirement for stocks above $6 is 30% of the current value. After the drawdown you need to end up with at least 30% equity in your account. This means that you could only have started with a ratio of $2 of equity against $1 of margin to avoid a margin call. Any more margin than this is very risky and over long periods will likely wipe you out. If we handle this instead by shorting SHY the calculation is a little different. The amount of equity can’t (in the case of Tradeking) go below 140% of the market value of SHY. This means that we can only use $1 of shorted SHY for every $4 of equity. Even if you don’t intend to own stocks on margin, but instead use the shorted SHY for something else, you still need to pay attention to this rule. (click to enlarge) I don’t own any stocks on margin, but I am shorting a small amount of SHY to take advantage of a 3% interest rate on a checking account. The maximum amount that I feel comfortable using is 20% of the total stock value of the account.

How Strong Is SCHV? I’m Considering It As A Core Holding.

Summary I’m taking a look at SCHV as a candidate for inclusion in my ETF portfolio. The risk level is great, though the high correlation to SPY shouldn’t be a surprise. The ETF has fairly decent yields and a great composition of companies. I’m not assessing any tax impacts. Investors should check their own situation for tax exposure. Investors should be seeking to improve their risk adjusted returns. I’m a big fan of using ETFs to achieve the risk adjusted returns relative to the portfolios that a normal investor can generate for themselves after trading costs. I’m working on building a new portfolio and I’m going to be analyzing several of the ETFs that I am considering for my personal portfolio. One of the funds that I’m considering is the Schwab U.S. Large-Cap Value ETF (NYSEARCA: SCHV ). I’ll be performing a substantial portion of my analysis along the lines of modern portfolio theory, so my goal is to find ways to minimize costs while achieving diversification to reduce my risk level What does SCHV do? SCHV attempts to track the total return of the Dow Jones U.S. Large-Cap Value Total Stock Market Index. At least 90% of funds are invested in companies that are part of the index. SCHV falls under the category of “Large Value”. Does SCHV provide diversification benefits to a portfolio? Each investor may hold a different portfolio, but I use (NYSEARCA: SPY ) as the basis for my analysis. I believe SPY, or another large cap U.S. fund with similar properties, represents the reasonable first step for many investors designing an ETF portfolio. Therefore, I start my diversification analysis by seeing how it works with SPY. I start with an ANOVA table: (click to enlarge) The correlation is about 98%. That’s simply too high to provide a very meaningful diversification benefit. I measure risk with the standard deviation of daily returns. It isn’t perfect, but it works fairly well for my purposes and seems to hold up over time. Because the correlation is very high, the standard deviation of returns will be a fairly significant factor. Standard deviation of daily returns (dividend adjusted, measured since January 2012) The standard deviation is great. For SCHV it is 0.7027%. For SPY, it is 0.7300% for the same period. Since SPY usually beats other ETFs in this regard, I’d look at that standard deviation level as being fairly favorable. Of course, since SPY and SCHV hold several of the same companies a high correlation was pretty much a given. Since the Value side of the index should have more stability and less risk, the findings are in line with my expectations. Mixing it with SPY I also run comparisons on the standard deviation of daily returns for the portfolio assuming that the portfolio is combined with the S&P 500. For research, I assume daily rebalancing because it dramatically simplifies the math. With a 50/50 weighting in a portfolio holding only SPY and SCHV, the standard deviation of daily returns across the entire portfolio is 0.7128%. The value side of the index (which SCHV is tracking) has been outperformed by the growth side of the portfolio. I would expect that to usually happen during a bull market. When a bear market occurs, I would expect the value side to hold up a little better. Since I believe in being fairly defensive about protecting capital, the value side is more appealing to me. Why I use standard deviation of daily returns I don’t believe historical returns have predictive power for future returns, but I do believe historical values for standard deviations of returns relative to other ETFs have some predictive power on future risks and correlations. Yield & Taxes The distribution yield is 2.33%. The SEC 30 day yield is 2.52%. I’m pretty comfortable with this ETF as an investment for retirees so far. In my opinion, it is a fine investment for younger investors as well. I have quite a while to go before retirement, but I still like healthy dividend yielding companies. Investors concerned about tax consequences should seek advice from someone knowledgeable about their tax situation. Expense Ratio The ETF is posting .07% for an expense ratio. This is great expense ratio. I treat the expense ratio as a very important metric when considering an investment. I want diversification, I want stability, and I don’t want to pay for them. Market to NAV The ETF is at a .02% premium to NAV currently. In my opinion, that’s not worth worrying about. It is practically trading right on top of NAV. However, premiums or discounts to NAV can change very quickly so investors should check prior to putting in an order. Largest Holdings The portfolio isn’t really top heavy. There are no holdings over 4%, but I still could go for slightly more diversification. With so many companies over 2%, the low standard deviation speaks to the stability of the companies within the ETF. (click to enlarge) I love having Exxon Mobil (NYSE: XOM ) as the top holding in the portfolio. I want exposure to gas because high gas prices can slow down the rest of the economy. In my opinion, it is hard to make an argument for any portfolio (under modern portfolio theory) that does not contain at least some exposure to gas prices. In my opinion, XOM is a reasonably safe way to get that exposure. You may notice Chevron is also in there. I think that is great as well. I don’t want to hold just one of the major gas companies. In my opinion, this is a fairly solid lineup. I’m still uncomfortable with Verizon (NYSE: VZ ) because I don’t like that industry in the current environment. However, at less than 2%, I have no problem with including it in a long term ETF position. When the industry becomes attractive again, it should be a great company to hold. Conclusion I’m currently screening a large volume of ETFs for my own portfolio. The portfolio I’m building is through Schwab, so I’m able to trade SCHV with no commissions. I have a strong preference for researching ETFs that are free to trade in my account, so most of my research will be on ETFs that fall under the “ETF OneSource” program. I’m finding SCHV pretty attractive and will consider giving it a niche in my portfolio. The size of the position depends on if I decided to use it as a core holding in place of SPY or SCHB. In that scenario, it could end up with a position as large as 20 to 25%. Otherwise, I would probably aim for something around 10%. Before I make a final decision I’ll need to run some analysis on complete potential portfolios. One way or another, my complete portfolio will include strong exposures to large cap U.S. companies and to heavy dividend paying companies.