Tag Archives: fn-start

PPL Corp. To Reward Investors In 2015

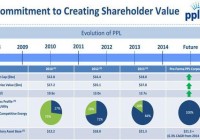
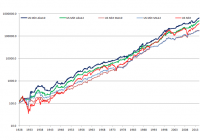
Summary A low treasury yield environment and efforts to reduce competitive energy operations will support PPL’s performance. Efforts to reduce competitive energy operations will positively affect bottom-line numbers and cash flows. PPL is likely to give full-year 2015 earnings guidance during its Q4 2014 earnings call. Utility stocks’ high dividend yields make them attractive investment options for dividend-seeking investors. The utility sector, including PPL Corp. (NYSE: PPL ), performed better than the S&P 500 in 2014. The outperformance of the utility sector was mainly due to the low treasury yield environment. In 2015, I believe PPL will deliver a healthy financial performance due to the ongoing low treasury yield environment and efforts made by the company to lower its competitive energy operations, which will bode well for its EPS. The company has been aggressively working to sell and reduce competitive energy operations, as the competitive energy operations remain challenging. Also, the company offers a healthy dividend yield of 4.3%, supported by its cash flows, which makes it a good investment option for dividend-seeking investors. All Set for 2015 In 2014, the utility sector performed better than the S&P 500. The better performance can be mainly attributed to the low treasury yield environment. In 2015, the utility sector will continue to deliver a healthy performance due to the low yield environment and efforts undertaken by utility companies, including PPL, to reduce their competitive energy operations. The following table shows the performance of the S&P 500, the utility sector ETF (NYSEARCA: XLU ) and PPL. S&P 500 XLU PPL 2014 Performance 12% 25% 22% Source: Bloomberg.com. Due to the weak commodity prices and capacity revenues, competitive energy operations of U.S. utility companies have remained challenging in recent years. In the current environment, utility companies are choosing to reduce their competitive energy operations and making efforts to grow regulated operations. PPL has also been expanding its regulated operations and reducing competitive energy operations, which will positively affect its EPS. The company opted to spin off its competitive energy business operations. The spin-off is expected to be completed in the first half of 2015. The spin-off will allow PPL to focus and expand its regulated business operations. The company is anticipating cost savings of $75 million from the transaction. Also, PPL has finalized a deal to sell its Montana hydro assets to NorthWestern Energy for $0.9 billion . PPL is expected to use cash from the sale to invest in the expansion of its regulated operations. Separately, PPL is taking measures to expand its regulated transmission operations. The company has announced its plans to build a transmission line, and is expected to make capital expenditures of approximately $5 billion over the life of the project. The company has planned to start building the line in 2016-17, and it should be in service by 2023-25. The capital expenditure PPL is planning to make will positively affect its top- and bottom-line growth in the long term. The company will have 100% exposure to regulated business operations in the coming years, which will positively affect its financial performance. The chart below shows that the company has been making consistent and aggressive efforts to reduce its competitive energy operations, and PPL’s regulatory rate base is expected to grow by 6.3% on average from 2014-18. (click to enlarge) Source: Company reports. As the company is expanding its regulated business and is in the planning phase, it will give its 2015 EPS guidance range in the Q4 2015 earnings call next month. Also, the company is likely to update its long-term EPS guidance, which I believe will be in a range of 4%-6%. Along with the earnings growth potential, PPL offers a safe dividend yield of 4.3% , backed by its cash flows. Its attractive dividend yield makes it a good investment for dividend-seeking investors. The company has consistently increased dividends over the years. In the coming years, dividends offered by the company will grow as an increase in its regulated operations will portend well for its bottom-line numbers and cash flows. The following chart shows the dividend per share, dividend payout ratio and dividend coverage ratio for PPL from 2012-2014. (Note * Dividend coverage ratio = operating cash flow/annual dividends, and 2014 figures below are based on estimates). Dividend Per Share ($) Dividend Payout Ratio Dividend Coverage* 2012 $1.44 60% 3.3x 2013 $1.47 60% 3.25x 2014* $1.49 64% 3.2x Source: Company reports and calculations. Conclusion PPL is set to deliver a healthy performance in 2015. The low treasury yield environment and efforts to reduce competitive energy operations will support PPL’s performance in 2015. The company’s efforts to reduce competitive energy operations will positively affect its bottom-line numbers and cash flows. Also, the company is likely to give its full-year 2015 earnings guidance during the Q4 2014 earnings call, which will improve earnings visibility and bode well for the stock price. Also, the stock offers a safe dividend yield of 4.3%. Due to the aforementioned factors, I am bullish on PPL.

Absolute Momentum Revisited

Trend following based absolute momentum, also known as time-series momentum, is the Rodney Dangerfield of investing. It “don’t get no respect.” Absolute momentum is little known and hardly used by investors. Yet it can be a very powerful tool, leading to both enhanced return during bull markets and reduced risk during bear markets. The more common type of momentum, based on relative strength, has little or no ability to reduce bear market drawdown. It may even increase volatility and downside risk. As I show in my book, Dual Momentum Investing , using both absolute and relative momentum simultaneously is the best approach in that it lets you benefit from the return enhancing characteristics of both types of momentum while incorporating the risk reducing benefits of absolute momentum. But absolute momentum has possible uses on its own for those who simply want to limit the downside risk and enhance the expected return of single assets or fixed portfolios. That is why I wrote the paper, “Absolute Momentum: A Simple Rule-Based Strategy and Universal Trend-Following Overlay,” which is now included as Appendix B in my book. I show how absolute momentum can be applied to a number of different indexes and assets, as well as to some common portfolio configurations, such as balanced stock/bond or simple risk parity portfolios. Absolute momentum is easy to calculate and apply. It is positive if an asset’s excess return (return less the Treasury bill rate) over a specified look back period is positive. One then holds that asset until absolute momentum turns negative. In my paper, I use data going back to January 1973, since bond index began at that time and international stock index data began close to it in January 1970. Elsewhere in my book, I also use January 1973 as the start date for my analysis, since my book’s featured Global Equities Momentum (GEM) model relies on the same fixed income and international stock indexes. Those wanting to see additional momentum result history can consult the references I give in the book showing attractive profits from relative strength and absolute momentum back to 1801 and 1903, respectively. However, I now think it would be a good idea now to extend my back testing of absolute momentum, since I learned that some investors are especially attracted to absolute momentum for several reasons. First, absolute momentum trades less frequently then dual momentum, which may be important for taxable accounts. Absolute momentum applied to just the U.S. stock market gives mostly long-term capital gains from stocks. The second reason absolute momentum may be worth looking at in more depth is that some investors have only a single investment approach that they are comfortable using. They may want to hold a portfolio that focuses solely on value plus profitability (see my earlier post, ” Value Investing Redux “), quality, hedge fund cloning, stock buy backs, dividend appreciation, micro caps, or other factors. So I think it would be helpful to see how absolute momentum looks when applied to aggregate U.S. stocks using the long-term Kenneth French data library that is available online. I compare 10 and 12 month absolute momentum filters to commonly-used 10 and 12 month simple moving average filters from April 1927 through December 2014, a period of 87 years. When we are out of stocks, assets are invested in one month Treasury bills. Here are the results with monthly readjusting of positions without transaction costs: Abs12 MA12 Abs10 MA10 US Mkt ANN RETURN 11.06 9.76 11.45 9.77 11.74 ANN STD DEV 12.53 12.83 12.88 12.50 18.70 ANN SHARPE 0.57 0.46 0.58 0.48 0.41 MAX DD -43.98 -48.22 -41.44 -56.62 -83.70 These are hypothetical results and are not an indicator of future results and do not represent returns that any investor actually attained. Please see our Disclaimer page for additional disclosures. (click to enlarge) We see that absolute momentum gives very attractive results compared to both buy and hold and the use of moving averages. Absolute momentum shows higher returns and Sharpe ratios, as well as lower maximum drawdowns, than comparable moving averages. In addition, moving averages have approximately 50% more trades and more false whipsaw signals than absolute momentum. So if we were to account for transaction costs, absolute momentum signals would look even more attractive compared to their moving average counterparts. Because of the additional transactions, moving averages are also not as tax efficient as absolute momentum. Dual momentum is still the premier momentum strategy for most investors, but absolute momentum may be a valuable tool for many others.

A Market Needing To Resolve Divergences In 2015

As 2014 has come to a close, investors have turned their attention to 2015 and looking for clues as to what the market and economy have in store for the new year. Below are divergences that unfolded in 2014 which raises the question of how they will be resolved this year. The resolution of these divergences will likely have implications on the performance of an investor portfolios this year. Oil Prices Knowing the stock market is not the economy and vice versa , determining factors contributing to the significant decline in oil prices is important. Certainly, increased supply is influencing the decline in crude prices. Equally though, as we have noted in several earlier articles, we believe lack of demand is also a contributing factor. The importance of the reduced demand leads strategists to raise the question of whether the global economy is entering a slowdown. To date, the U.S. seems to have shaken off the potentially negative impact of slowing economies outside its borders. Given the interconnectedness of the economic world today though, can the U.S. continue on its growth path while many other economies in the developed and emerging world struggle with growth? As the below chart indicates, historically, falling oil prices have been associated with slowing global GDP. Aubrey Basdeo, Managing Director at Blackrock, noted the potential negative impact of an extended run of low oil prices in an article late last year titled, Free Fallin’ . The article’s conclusion, Wherever the price ends up, it’s likely it’ll stay there for a while. We don’t see demand increasing, especially with China cooling off. In the short-term that could be good news for our economy – lower gas prices mean people have more money to spend – but it remains to be seen just how our country will be impacted by a sub-$60 oil price. The longer it stays low, though, the more difficult things could get. Highlighted in the Felder reference below was a comment by Howard Marks’ in a recent investor letter , “It’s historically unprecedented for the energy sector to witness this type of market downturn while the rest of the economy is operating normally. Like in 2002, we could see a scenario where the effects of this sector dislocation spread wider in a general ‘contagion.'” High Yield Bonds: Reduced Investor Risk Appetite The performance of high yield bonds has an above average positive correlation to the performance of equities. In short, as the economy grows, companies tend to experience better earnings growth. This improved earnings outlook generally leads to improved equity returns. Broadly, as companies generate better earnings growth, highly leveraged ones tend to experience an improved outlook as well. This in turn reduces the risk of default with highly leveraged companies. Consequently, high yield bond prices are bid up as investors are attracted to the higher yields provided by high yield debt in an environment where default risk seems lessened. A recent article by Jesse Felder of The Felder Report took an in depth look at the long term and short term price movements of high yield (NYSEARCA: HYG ) relative to a riskless 3-7 year Treasury ETF (NYSEARCA: IEI ) and the S&P 500 Index . As the first chart below shows, the high yield relative to treasury bond investment tracks closely with the S&P 500 Index. Felder notes in his article, Clearly, the chart above demonstrates that the strength in junk risk appetites led stocks off the lows back in 2009. Over the past summer, however, junk bonds started to lag stocks for the first time since the bull began (or lead lower, depending on your perspective). Since then the divergence has only gotten wider with each subsequent new high in the stock market [as seen in the below chart]: Large Caps Versus Small Caps And The Dollar The one asset allocation decision investors and advisers needed to get right in 2014 was to overweight U.S. equities, large caps more specifically, versus broad international. As can be seen in the two charts below, U.S. large cap stocks had a decisive performance edge versus developed international (NYSEARCA: EFA ), emerging markets (NYSEARCA: EEM ) and small cap equities (NYSEARCA: IWM ). With economies currently weaker outside the U.S. and interest rates lower in many European countries, foreign investors have allocated investment dollars to the U.S. This flow of funds into the U.S. has contributed to downward pressure on U.S. interest rates as well as continued upward pressure on the U.S. Dollar. The top chart above shows a longer view of the trade weighted US Dollar and its recent strength, although strong shorter term, the strength does not look exhausted when viewing the longer term chart. The implication of a stronger dollar has to do with the potential earnings headwind for large multinational companies. In a slow growing economy, the currency headwind can take a bite out of corporate profit growth. If this occurs, small and mid size companies are less exposed to exchange rates as business for these companies is mostly generated domestically. Lastly, the U.S. equity markets opened higher on the first trading day of the new year, but quickly turned lower near the time the ISM Manufacturing Index was reported. The manufacturing index was reported at 55.5 which was below consensus expectations of 57.5. This was the slowest rate of monthly growth in six months. Econoday noted, “growth in new orders slowed substantially, to 57.3 from November’s exceptionally strong 66.0, while backlog accumulation also slowed, to 52.5 from 55.0. Production slowed to 58.8 vs. 64.4….The abundant run of manufacturing reports point to year-end slowing in a sector which is oscillating going into the New Year.” The above highlights are just a few divergent factors that have developed recently. From a positive perspective, the equity markets have a tendency to climb the proverbial ” wall of worry .” We will cover more of our thoughts on these topics in our upcoming year end Investor Letter.