Tag Archives: fn-start

Dull Industrial Earnings Put These ETFs In Focus

As previously expected the Industrial sector has come out with lukewarm results for the fourth quarter earnings season. The major players in the space, such as General Electric (NYSE: GE ) , Caterpillar Inc. (NYSE: CAT ) and 3M Company (NYSE: MMM ) , have reported lackluster results, missing either on revenues or earnings. In fact, a disappointing performance from industrial leader Caterpillar and weaker-than-expected data on durable-goods orders sparked fears about a slowdown in economic growth, leading the Dow Jones Industrial Average to plunge more than 350 points in yesterday’s trading session. Industrial Earnings in Focus General Electric Operating earnings for the reported quarter came in at 56 cents per share compared with 53 cents a share in the year-ago quarter, beating the Zacks Consensus Estimate by a penny. The company posted net earnings of 51 cents per share, up 61% year over year. Total revenue for the quarter increased 4% year over year to $42 billion but fell short of the Zacks Consensus Estimate of $42.4 billion. The company’s operating profit in the Industrial segment increased 9% in the reported quarter as its businesses that sell power-generating turbines and jet engines helped offset weak sales in its oil and gas unit. However, GE Capital’s profit declined 19% year over year to $1.9 billion. The company, however, is committed to increasing its focus on industrial operations, away from finance. Caterpillar Mining and equipment behemoth Caterpillar however missed Q4 earnings estimates and also guided lower for 2015. Earnings per share declined 20% year over year to $1.35 per share, missing the estimates by 13%. Revenues declined 1% year over year to $14.2 billion in the quarter but surpassed the Zacks Consensus Estimate of $14.1 billion. The company blamed the muted mining environment and lower prices of oil and key mined commodities, particularly copper, coal and iron ore as the key factors behind the earnings miss. Moreover, the company also guided materially lower for 2015 due to continued weakness in oil prices. The company expects 2015 EPS of $4.75 on $50 billion in revenues, significantly below the current Zacks Consensus Estimate for 2015 of $6.69 in EPS on $54.6 billion in revenues Union Pacific Corporation (NYSE: UNP ) The rail transportation operator, Union Pacific , managed to beat our estimates on both fronts. Earnings per share rose 27% year over year to $1.61, beating the Zacks Consensus Estimate of $1.51, while revenues increased 9% year over year to $6.2 billion, ahead of the Zacks Consensus Estimate of $6.1 billion. 3M Company Like General Electric and Caterpillar, 3M also reported mixed financial results, beating on the earnings front but missing on revenues. Earnings per share came in at $1.81 per share, up 11.7% year over year, beating the Zacks Consensus Estimate by 2 cents a share. Net sales during the quarter were $7,719 million, up 2% year over year, but below the Zacks Consensus Estimate of $7,779 million. Market Impact Uneven earnings results from the top industrial stocks saw mixed reactions. While GE is up 5% since its announcement on January 23, Caterpillar shed 7% yesterday following its disappointing results. Meanwhile, 3M and Union Pacific closed marginally lower following their earnings. Given the uninspiring earnings results from some of the top industrial players, investors should cautiously play the industrial ETF space for the upcoming days. Below, we have highlighted three industrial ETFs having a sizeable exposure to the above stocks. Industrial Select Sector SPDR (NYSEARCA: XLI ) XLI is the most popular fund in the space with an asset base of $8.8 billion and an average daily trading volume of 9.9 million shares. The fund provides exposure to a basket of 66 stocks charging 65 basis points as fees. General Electric occupies the top spot with 9.3% allocation, while Union Pacific, 3M and Caterpillar have a combined exposure of roughly 14.2% in the fund. XLI lost 1.32% on Tuesday but is up 13.1% in the past one year and currently has a Zacks ETF Rank #3 or Hold rating. Vanguard Industrials ETF (NYSEARCA: VIS ) VIS is also quite a popular fund in the space with an asset base of more than $1.9 billion and trading with moderate volumes. VIS tracks the MSCI U.S. Investable Market Industrials 25/50 Index to provide exposure to 352 industrial stocks. The four stocks have a combined exposure of roughly 21%. VIS lost 1.2% in yesterday’s session and currently has a Zacks ETF Rank #3 or Hold rating. iShares U.S. Industrials ETF (NYSEARCA: IYJ ) IYJ tracks the Dow Jones U.S. Industrials Index to provide exposure to U.S. companies that produce goods used in construction and manufacturing. General Electric, Union Pacific, 3M and Caterpillar are among the top 10 holdings with a combined exposure of roughly 19.4%. The fund manages an asset base of $ 861.5 million and is slightly expensive with 43 basis points as fees. IYF currently has a Zacks ETF Rank #3 or Hold rating.
Inside The New Target Factor ETFs From iShares

Deflationary fear and a slowdown have started to trouble developed international markets, and most investors in the ETF world are looking out for quality exposure in the area. In fact, some aggressive investors are hunting for high momentum stocks presuming that these might outperform in the days ahead in the prevailing easy money era. Their search looks justified. After all, the Fed withdrew its gigantic QE program last year and might start walking the way of policy tightening later this year. Thanks to such policy differential in the developed world, iShares – the largest ETF issuer in the world – brought about two products targeting the developed international economies probably to quench investors’ thirst. We have detailed the two newly launched funds below. iShares MSCI International Developed Momentum Factor ETF ( IMTM) : For a broad foreign market play with a focus on large-and-mid cap companies, investors could consider IMTM which focuses on 12 developed countries for exposure. Stocks that exhibit a higher price momentum will be included in the fund. This product follows the MSCI World ex USA Momentum Index, holding 269 securities in its basket and charging a pretty low fee of 30 basis points a year for this relatively unique exposure. Though the fund holds about 28% exposure in the defensive health care sector, it is more inclined toward higher beta sectors like financials, industrials companies and consumer discretionary. Top nations include Japan (29.6%), Canada (18.0%), and Switzerland (12.9%) while the U.K. (8.8%) and Germany (4.7%) round out the top five for this well-diversified fund. The fund does not have much company concentration risk with no stock accounting for more than 5.34% of the fund. Novartis (NYSE: NVS ), Roche and Bayer ( OTCPK:BAYRY ) are the top-three holdings of the fund. IMTM Competition: Momentum strategy is not yet popular in the ETF world. Though the domestic economy has a couple of ETFs including the $1.46 billion-First Trust Dorsey Wright Focus 5 ETF (NASDAQ: FV ), $1.61 billion-PowerShares DWA Momentum Portfolio (NYSEARCA: PDP ) and $515 million-iShares MSCI USA Momentum Factor ETF (NYSEARCA: MTUM ), the international arena is relatively less penetrated. Global Momentum ETF (NYSEARCA: GMOM ) made an entry late last year in the international space and has amassed about $26 million in assets so far. Given GMOM’s high expense ratio of 94 bps and iShares’ own product MTUM’s considerable success in a short span, we expect the issuer to replicate the success on its global version as well. However, the issuer should take note of Cambria’s active approach to the momentum theme which might give it an edge over IMTM in volatile markets. iShares MSCI International Developed Quality Factor ETF ( IQLT) : This fund gives investors exposure to quality stocks (excluding U.S.) by identifying companies that have the highest quality scores based on three main fundamental variables – high return on equity, stable earnings year-over-year growth and low financial leverage. The product charges investors 30 basis points a year in fees and tracks the MSCI World ex USA Sector Neutral Quality Index. The fund holds about 289 securities in its basket with a focus on financials (26.9%). Industrials (12.1%), Consumer Discretionary (11.5%), Health Care (10.8%) and Consumer Staples (10.6%) occupy the next four spots. The fund is heavy on the U.K. with about one-fourth of the exposure followed by Switzerland (15.6%). Roche takes the top-most allocation in the portfolio with about 5.2% exposure followed by Novo Nordisk (2.7%) and Nestle (2.31%). IQLT Competition: There are currently a few products operating in the space including PowerShares S&P International Developed High Quality Portfolio (NYSEARCA: IDHQ ), SPDR MSCI World Quality Mix ETF (NYSEARCA: QWLD ) and Market Vectors MSCI International Quality ETF (NYSEARCA: QXUS ). While neither has developed a huge following so far and IDHQ charges a bit high at 55 bps, IQLT has scope for outperformance.

RevenueShares Ultra Dividend Has Utility

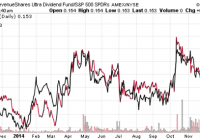
Summary RDIV has a relatively high yield compared to its nearest competitors such as DVY. RDIV takes the S&P 500 Index, pulls out the top 60 highest yielding stocks, and then weights them by revenues. RDIV’s strategy in the current market environment results in a very utilities heavy portfolio. RevenueShares takes a different approach to indexing. Instead of using the market capitalization approach to weighting index constituents, the firm uses a company’s share of revenues. RevenueShares takes an existing S&P index such as the S&P 500 Index and then applies the different weighting methodology. One of the main arguments against market capitalization weighted indexes is the valuation argument. As the price of a stock rises, so does its market cap, and over time a market cap weighted index becomes increasingly weighted towards overvalued shares. By using revenues as a weighting strategy, as a stock price rises faster than its revenue share, it is sold off at rebalancings. If a company’s stock price falls, but its revenues are steady or rise as a share of the index, it is purchased at each rebalancing. In other words, stocks that are overvalued by the price-to-sales metric are sold, and stocks that are undervalued by the price-to-sales ratio are purchased. RevenueShares has a dividend fund that uses this strategy: the RevenueShares Ultra Dividend ETF (NYSEARCA: RDIV ) . Index & Strategy As mentioned, RDIV weights the index by revenues. The index constituent universe is the S&P 500 Index. The field is narrowed to the top 60 stocks, ranked by the average 12-month trailing dividend yield. Holdings are then weighted by revenue. The result is a portfolio heavily overweight the top holdings in the modified index, as well as overweight the “defensive” sectors. The top 10 holdings are book-ended by Duke Energy (NYSE: DUK ) at the top, with a 5.07 percent weight as of January 26, and Kinder Morgan (NYSE: KMI ) at the bottom with 4.20 percent of assets. The top 10 holdings combine for 46.70 percent of assets. Utilities dominate sector exposure, with 39 percent of assets. The telecom sector is also overweight relative to the S&P 500 Index, at 17 percent of assets. Consumer staples and energy make up 16 percent and 13 percent of assets, respectively. Technology is almost non-existent at 0.19 percent of assets. Financials are very underweight relative to the S&P 500 at 4 percent of assets, and there’s no healthcare exposure. This makes for a very “defensive” portfolio whose performance currently lives and dies by the utilities sector. Performance RDIV’s inception date is October 2013. For much of this period, the utilities sector has performed very well and it was the best performing S&P 500 sector in 2014. The first chart here is the price ratio of RDIV versus the SPDR S&P 500 Trust ETF (NYSEARCA: SPY ) in red. In black, for comparison, is the price ratio of the Utilities Select Sector SPDR ETF (NYSEARCA: XLU ) versus SPY. The chart confirms what the sector exposure tells us: RDIV is highly influenced by the utilities sector. (click to enlarge) A dividend ETF with a similarly high concentration in utilities is the iShares Select Dividend ETF (NYSEARCA: DVY ), and the two funds fall into nearly the same section of Morningstar’s Stylebox: Large Cap Value. DVY falls on the line with the mid cap box and gets a Mid-Cap Value classification from Morningstar. The chart below shows the price ratio of RDIV to DVY, plus the price of the Industrial Select Sector SPDR ETF (NYSEARCA: XLI ). Industrials is the second largest sector in DVY. When industrials have rallied, RDIV trailed DVY, and vice versa. (click to enlarge) Finally, here’s a performance chart of RDIV, DVY, SDY and SPY since the inception of RDIV, showing that despite having different sector exposure, they’ve largely traded together. RDIV comes out on top thanks to it large utilities exposure. (click to enlarge) Expenses RDIV charges 0.49 percent. This is higher than DVY’s 0.39 percent and SDY’s 0.35 percent expense ratio. Income RDIV has a trailing 12-month yield of 3.26 percent. With only five quarters of dividend payments, it’s too early to evaluate the fund’s payout growth rate. The yield exceeds DVY’s 12-month trailing yield of 3.03 percent. Conclusion RDIV is a new fund that hasn’t found a large following yet, amassing only $52 million in assets in its first 15 months. The heavy weighting of the utility sector is an issue, but DVY has attracted nearly $16 billion in assets with nearly as much in the sector. Overall, the revenue weighting strategy shows a good track record and the yield on RDIV is competitive with the competition. Sector exposure won’t always lean in favor of utilities this much, but for the foreseeable future that’s likely to still be the case. Investors comfortable with that level of exposure can consider the fund as part of a dividend strategy. The main risk for the fund is the same for the utilities sector and dividend funds more generally. If interest rates stay low, investors will eventually bid up RDIV’s holdings until the yield gap with other dividend ETFs closes. If interest rates increase, the high debt utilities sector will come under pressure and investors will look beyond dividend shares to other income alternatives. Rates have come down substantially over the past couple of months though, so a major rebound will be required to take rates back to a level where they are competitive with stocks. The 30-year treasury yield was 2.40 percent as of January 26, down from 3.1 percent in November.