Tag Archives: fn-start

Investing In A Multidimensional Market

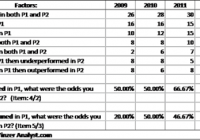
By Bruce I. Jacobs and Kenneth N. Levy, CFA Twenty-six years ago, the Financial Analysts Journal published our findings on the payoffs to stock market “anomalies” – stock price behaviors that were considered anomalous in the context of the efficient market hypothesis. We found the market to be permeated with a complex web of such price behaviors , reflecting the interaction of numerous fundamental and behavioral factors, as well as such institutional features as the regulatory environment. Known anomalies at that time totaled about 25, but no one had considered them jointly. We were the first to recognize the importance of examining multiple anomalies simultaneously. We pioneered the disentangling of the return relationships among numerous anomalies, deriving ” pure ” returns to each one, independent of the influences of all other anomalies. Controlling for cross-correlations among anomalies provides a clearer picture of return-predictor relationships and distinguishes anomalies that are real from those that are merely proxies for other effects. Our findings revealed a much greater dimensionality to the stock market than suggested by the one-factor capital asset pricing model (CAPM) or by previous studies that looked at only one or a few anomalies. A model with greater dimensionality is better able to explain the cross-section of stock returns. Moreover, we have found that the resulting purified returns to anomalies provide better predictions of stock returns than the results from analyzing each anomaly individually. As Harry Markowitz noted in his foreword to Equity Management: Quantitative Analysis for Stock Selection : Such disentangling of multiple equity attributes improves estimates of expected returns. This finding is confirmed in recent empirical work by Lewellen (forthcoming), who showed that using more factors improves the explanatory power of models that aim to predict returns. These findings raise questions about today’s investment trend toward “smart beta” strategies, which target a limited number of anomalies, or factors – such as small size, value, price momentum, and low volatility – that have performed well historically. Smart beta strategies assume a stock market in which a few chosen factors produce persistent returns. As we will discuss, this assumption is not a good approximation of what is observed in reality. The Market’s Multidimensionality Over the last few decades, researchers have uncovered hundreds of factors . But some of these factors can be dismissed because they cannot be replicated or they are unable to predict returns out of sample – either in other time periods or in other markets. The significance of many of the remaining factors may also be questionable. For example, Harvey, Liu, and Zhu argued that many factors have been “discovered” because researchers frequently ignore the possibility that a certain number of factors are bound to show statistically significant results merely by chance. They suggested that given the large number of factors tested to date, using a t -statistic of 3.0, rather than the traditional threshold of 2.0, can help weed out factors that appear valid but are actually only the result of data mining or chance. Even with this more stringent standard, remarkable dimensionality exists in the market. In our original research, we found that 9 of the 25 factors tested were significant, with a t -statistic of 3.0 or higher, when the factor returns were purified via multivariate analysis. Our significant factors included low price-to-earnings ratio, but not low share price; the sales-to-price ratio, but not the book-to-price ratio; earnings surprises within the last month, but not in previous months; relative strength (price momentum); revisions in analysts’ earnings estimates; and return reversals. Small size was marginally significant. (The t -statistic for small size was 2.7. Given the small number of factors that had been tested up to that time, a t -statistic of this magnitude was arguably significant.) Contrary to the CAPM, market beta was not significant even during a bull market. Our list of factors covered most of the factors now included under the smart beta umbrella, and we identified as statistically significant several times the number of factors generally pursued today by smart beta strategies. More recently, Green, Hand, and Zhang confirmed the remarkable multidimensionality of the stock market . They performed multivariate testing on 100 factors and found 24 factors with t -statistics in excess of 3.0. Interestingly, some popular smart beta factors, such as size, book-to-price ratio, and price momentum, were not among the most significant factors. Advantages of a Multidimensional Approach A factor-investing approach that maintains a constant tilt toward one or a few factors is simple and intuitive. However, such an approach ignores potential returns available from other significant factors, as well as the variability over time in returns to the targeted factors. A multidimensional portfolio can achieve exposures to a large number of factors and is thus poised to take advantage of more opportunities than a smart beta strategy that is based on only one or a few factors. Furthermore, a multidimensional portfolio benefits from diversification across numerous factors. It is less susceptible than a smart beta portfolio to the poor performance of any one factor. As some factors underperform, others may outperform, fostering greater consistency of performance. (Because exposure to factors is obtained through holdings in underlying securities, factor diversification in a multidimensional portfolio is achieved through diversified security holdings.) For example, price momentum, a factor used in some smart beta strategies, is prone to occasional crashes. When the market reversed direction after bottoming in 2009, the momentum factor crashed. But returns to the momentum factor tend to be negatively correlated with returns to value factors, because momentum strategies buy past winners and sell losers whereas value strategies typically buy past losers and sell winners. Indeed, when the momentum factor produced large losses in 2009, the book-to-price value factor performed well. To smooth returns, investors may choose to use both a momentum smart beta strategy and a value smart beta strategy. But using separate strategies can be a problem. Although different strategies focus on different factors, their security holdings may overlap, increasing security risk, or the strategies may trade the same security in opposite directions, increasing transaction costs. An alternative is to combine the value factor and the momentum factor in a single portfolio. This approach will also smooth returns while avoiding security overlaps and unnecessary trading. However, such a two-dimensional factor strategy could be improved by using additional factor dimensions. For example, after the market trough in 2009, the small-size factor would have further boosted the performance of the strategy. By combining momentum, value, size, and many other important factors in a multidimensional strategy, it is possible to achieve more consistent performance than can be achieved by a smart beta strategy based on just a few factors. Although returns to factors vary over time (as our previous example highlights), some factors’ return variations may be predictable given the relationships between factors and economic or market conditions. Pure returns to the small-size factor, for instance, may be predictable on the basis of underlying conditions . Because smart beta strategies hold a constant exposure to one or a few factors, regardless of underlying conditions, their performance may be challenged by the variability of factor returns. The rebalancing rules of smart beta strategies also limit their profit opportunities. Consider the returns to earnings surprises and return reversals, which decay quickly. These factors would be difficult to capture with the infrequent rebalancing of most smart beta strategies. Strategies that can trade as opportunities arise are better able to exploit time-sensitive factor returns, provided the trades are expected to be profitable net of transaction costs. Smart beta strategies are often based on common, generic factors used by many managers. This approach leaves their performance susceptible to factor crowding: Too many investors are buying (or selling) the same securities on the basis of the same factors. This can lead to factor overvaluation and factor crises, just as too many investors chasing any asset can lead to overvaluation and corrections. For instance, Khandani and Lo argued that in August 2007, the forced deleveraging of some quantitative hedge funds necessitated their liquidating stocks associated with commonly used factors , which caused performance difficulties for other quantitative managers using similar factors. In addition, the generic nature of the factors used by smart beta strategies, combined with their known rebalancing rules, may render them vulnerable to front running. Front running can occur when traders anticipate the rebalancing needs of smart beta strategies and trade stocks expected to be added to or dropped from smart beta portfolios in the near future. It is well known that the annual rebalancing of the most prominent small-capitalization stock index is affected by front running. Recent evidence has documented adverse price pressure on smart beta strategies that rebalance on the basis of the Fama-French size and book-to-market value factors . As smart beta assets grow, adverse price pressure may increase, leading to higher rebalancing costs. Greater price pressure would create larger opportunities for front runners to profit at the expense of smart beta strategies. Overcrowding and front running are less of a problem for strategies that use proprietary, rather than generic, factors. Proprietary factor definitions are not publicly available and vary from manager to manager, and managers using proprietary factors typically close their strategies to new assets when approaching capacity limits. Because smart beta strategies rely on commonly used factors, they are more likely to encounter price pressures resulting from other managers’ trades or from front runners. The simplicity and transparency of smart beta strategies offer greater accessibility and can result in lower management costs. However, although annual portfolio turnover is usually low for smart beta strategies, trading costs at the periodic rebalancings may be exacerbated by price pressure and front running. Multidimensional strategies, which use numerous factors, are neither simple nor transparent. Hence, assessing the investment process is more demanding for the asset owner. But such strategies can benefit from proprietary factors, which also make them less susceptible to factor crowding and front running. Finally, smart beta strategies shift the decisions about the selection of factors and the timing of factor exposures from the investment manager to the asset owner. In shouldering these responsibilities, asset owners may take on new risks and incur costs beyond the low fees charged by smart beta managers. Multidimensional strategy managers, in contrast, take responsibility for the investment decisions. Conclusion Many years ago, we pioneered the disentangling of a large number of factors in the stock market and showed many to be significant. Subsequent research has confirmed the market’s remarkable multidimensionality: The market has many factors that are both intuitively sensible and statistically and economically significant. We believe that investment strategies based on numerous proprietary factors that dynamically adjust to market conditions have several advantages over smart beta strategies based on a few common, generic factors. Using proprietary factors can provide unique value while mitigating factor crowding and front running. Such a dynamic, multidimensional approach can also improve performance consistency, because it allows for diversification across many proprietary factors and for adjustment of the exposures to those factors over time. Disclaimer: Please note that the content of this site should not be construed as investment advice, nor do the opinions expressed necessarily reflect the views of CFA Institute.

Does Every Dog Have Its Day?

The Yinzer Analyst is a simple man; he likes his beer cold, his Bills winning and his mutual funds simple, so you can imagine over the years he’s found himself increasing disappointed, and not just by the Buffalo Bills. The trend among mutual funds has been to develop increasingly opaque strategies as a way to justify high management fees for subpar performance when compared to index funds or ETF’s. From years of researching equity mutual funds I can tell you there are essentially three models; indexed, active managers who are actually indexers, and true active managers; and at the heart of every successful equity mutual fund is a process to find and select individual securities. Some are incredibly complex while others are simply the result of one manager’s particular process. One fund that has eschewed complicated strategies and has still managed to deliver superior returns is the SunAmerica Focused Dividend Strategy (MUTF: FDSAX ), once the darling of Barron’s magazine and that has since fallen on rough times. Now when I say FDSAX has an easy to understand strategy, I mean it’s so easy that even someone relatively new to investing should be able to follow the logic behind its construction. Simply put, it’s something I like to think of as “Dogs of the Dow +” in this case actually the 10 highest yielding stocks in the Dow Jones Industrial Average plus 20 stocks from the Russell 1000 (which may also include the Dogs of the Dows). The stocks chosen from the Russell 1000 are selected based on a screening process that looks at valuation, profitability and earnings growth. The portfolio is put together annually and with the positions more-or-less equally weighted with no concern towards sector weightings and held for an entire year. That’s all there is to it. Now I choose to call it the “Dogs of the Dow +” given that I think it’s fairly reasonable to assume that the 10 highest yielding stocks are likely to be the ten worst performers over the previous year and while the specific metrics used to pick the stocks for the Russell 1000 aren’t publicly disclosed, my assumption is that the system used by SunAmerica would be recognizable to stalwarts of the investment profession like Benjamin Graham. At its core, the investment theory governing the portfolio construction process (as well as any valuation based investment strategy) isn’t quite reversion to the mean but something close; the idea that stocks will gravitate around an intrinsic value, occasionally becoming too expensive or too cheap relative to that value. Over time, investors will become reluctant to pay for already “overpriced” stocks and begin seeking out “cheaper” securities and as the Dow components are some of the largest and most widely followed stocks in the world, they’re a logical place for investors to start their portfolio construction process. As one of the most well-known relative valuation strategies, The Dogs of the Dow Theory has been used for decades, often with mixed results but typically over a long-time period it delivers returns in-line with the broader Dow Jones Industrial Average and often with the benefit of reduced volatility. FDSAX is a good example of relative valuation strategies at work; after underperforming during the latter part of the mid-2000’s bull market, the FDSAX outperformed for 5 of the 7 years between 2007-2013 and in its worst year (2012) only lagged the S&P 500 by 320 basis points but something changed in 2014. Despite the strong outperformance by large-cap value stocks, FDSAX lagged the S&P 500 by 463 basis points and the fund dropped to almost the lowest quartile within the Large Value category. While the trailing three-year annualized return is still 19.84% compared to 20.41% for the S&P 500 and 18.33% for the category as a whole (with less volatility-win/win), it got me thinking…is there a problem with the Dogs of the Dow? The general rule of thumb taught in business schools is that any moderately successful trading strategy that generates excess returns relative to the benchmark is bound to be copied and thus eliminating any further potential for oversized gains. But despite 6 years of college, one more and I could have been a doctor; the Yinzer Analyst has always been something of a heretic. Even after the popularization of the Efficient Market Hypothesis, there’s been ample evidence that shows some individuals can outperform the market both consistently and over sufficiently long periods to prove that there’s more to their outperformance than simple luck. Some degree of skill or investor psychology makes certain trading strategies repeatedly profitable. So lacking anything better to do on a Saturday, I decided to slap together a quick experiment to test the Dogs of the Dow Theory and see if you can reasonable expect that the worst performers from one period (year) will outperform in the next. Now it’s been a long time since I studied statistics, so this is a fairly basic test and just to avoid being called a complete crack-pot, let me outline my process: After pulling the performance data for all Dow Components from 2008-2014, I set up my worksheets to test whether a stock that outperformed (underperformed) the rest of the Dow Jones Industrial Average would outperform (underperform) in the next. So every year is really a two-period test. If you outperformed in 2009 (period 1) did you outperform again in 2010 (period 2.) To be included in the test, the stock had to be present in the Dow for the entire time frame in question. As an example, on 9/24/12, Kraft foods (NASDAQ: KRFT ) was replaced in the Dow Jones by United Healthcare and then on 9/23/13, Alcoa (NYSE: AA ), Bank of America (NYSE: BAC ) and Hewlett Packard (NYSE: HPQ ) were dropped and replaced by Goldman Sachs (NYSE: GS ), Nike (NYSE: NKE ) and Visa (NYSE: V ). So when I was looking at the period of 2012-2013, there were only 26 stocks to test (no United Healthcare, Alcoa, Bank of America or HP) while in 2014, I only had 27 Dow components to test (no GS, Nike or Visa since they weren’t included for all of 2013.) I also only went back to 2009 as I was both pressed for time and not willing to beg someone with access to Direct or Bloomberg to pull additional return data for me. Still, I think the results in the table below are very illuminating: (click to enlarge) As you can see at the bottom of every column, I choose to interpret the results with two basic formulas asking, “If you outperformed in period 1 (example 2009), what were the odds you outperformed in period 2 (2010)?” In the 2009-2010 period, of the 16 stocks that outperformed in 2009, 8 outperformed in 2010. For 2010, the 12 Dow components that underperformed the total index in 2009 (P1) were equally as like to outperform versus underperform the benchmark in 2010 (P2). Although there are too many variables to count as to why one stock outperforms and another doesn’t, and there’s a host of ex-ante versus ex-post issues to consider, if you were simply picking the worst performing Dow stocks for your portfolio, it was a coin toss whether one outperformed the benchmark and another didn’t. While the odds worsened slightly in 2011 and 2012, they were only slightly worse than a coin toss and picking a prior winning stock to keep winning sure didn’t guarantee anything in 2010 or 2012. What’s interesting to me is how the odds have worsened over the last two years to reach the sample extreme in 2014. If at end of 2013 you picked one of the 12 Dow components that underperformed that year, you had a ¼ chance of picking an outperformer in 2014. Only Cisco, Proctor&Gamble and Wal-Mart pulled that off. The other 9 underperformed for a second consecutive year or in the case of Coca-Cola (NYSE: KO ), Chevron (NYSE: CVX ), IBM (NYSE: IBM ), McDonalds (NYSE: MCD ) (all currently held by FDSAX) and Exxon Mobil (NYSE: XOM ) for the third consecutive year in the row. Caterpillar (NYSE: CAT ) (not part of the fund) has now underperformed for four years in a row, some global recovery. Of you could look at it in a different manner; there were 27 stocks in the Dow Jones Industrial Average in 2013 and 2014, if you had picked one at random on 12/31/12, there was a 1/3 chance that you would have underperformed the index over the next two years! No wonder FDSAX underperformed the benchmark in 2014 although it only underperformed the larger category of Large Value funds by 116 basis points. Assuming that most of the outperformers were index funds and that fee’s were a major determinant of outperformance last year, I might have to compare the fund’s performance to other active managers in the space to determine whether FDSAX is a Yinzer Analyst Best Buy, or at the very least how awful active management really was in 2014. If you were part of the management team at FDSAX and if you selected 10 Dow Jones Industrial underperformers on 12/31/13 to include in 2014 and the relationship held, 7.5 (let’s round up to 8) of those stocks would likely underperform in 2014 and with an average weighting of 3.4%, 27.2% of your portfolio was going to underperform in 2014. That’s putting a lot of pressure on the rest of your portfolio to outperform so you can keep yourself around benchmark. If a similar relationship held for stocks within the broader Russell 1000, your chances of performing in-line with the benchmark were slim-to-none while outperforming after fee’s wasn’t even within the realm of possibility. The question is what happens in 2015? Given the extremes between persistence in outperformers and underperformers in 2014; is it reasonable to assume that mean reversion might kick in and see the Dogs of the Dow finally have their day again in 2015? If so, thanks to its formulaic nature; FDSAX could find itself very well-situated to take advantage of that trend. Keep your eyes on those persistent underperformers like Chevron and IBM to see if they can give SunAmerica a happier New Year.

Vanguard Portfolio Part 5: 4th Quarter Results

My portfolio gained 2.24% points in the fourth quarter. My portfolio’s end of year return was 9.88%. My portfolio beat 2 of 3 selected indices. The fourth quarter and year has ended for my all Vanguard portfolio . The quarterly and year to date reviews are below. Performance: My portfolio in the fourth quarter rebounded from the third quarter . It increased 2.24 percentage points. All three benchmarks performed better this quarter and all out performed my portfolio. The EOY return on my portfolio increased to 9.88%. I am still outperforming two of the indexes. I did so well the first half of the year that even though I slid in the second half I still did well. The table below shows the fourth quarter and YTD returns. 4th Qtr. % change EOY Return Vanguard 2.24% 9.88% S&P 500 5.79% 12.39% DJIA 6.6% 8.4% Russell 2000 10.99% 3.41% Below are the returns of all my positions at the end of the year. I took a piece of advice from a comment in my third quarter paper. I summed up the values of the same ETF in each different account. The table should be easier to read this time. Ticker % Chg Annualized Yield Vanguard Mega Cap Value ETF (NYSEARCA: MGV ) 13.13% 13.94% Vanguard Materials ETF (NYSEARCA: VAW ) 4.13% 6.60% Vanguard Small Cap ETF (NYSEARCA: VB ) 7.22% 10.04% Vanguard Small Cap Growth ETF (NYSEARCA: VBK ) 3.49% 4.57% Vanguard Small Cap Value ETF (NYSEARCA: VBR ) 7.37% 9.23% Vanguard Consumer Discretionary ETF (NYSEARCA: VCR ) 13.90% 15.14% Vanguard Consumer Staples ETF (NYSEARCA: VDC ) 14.24% 15.51% Vanguard Energy ETF (NYSEARCA: VDE ) -6.66% -8.22% Vanguard FTSE Developed Markets ETF (NYSEARCA: VEA ) -6.54% -12.18% Vanguard FTSE All-World ex-US ETF (NYSEARCA: VEU ) -5.71% -10.68% Vanguard Financials ETF (NYSEARCA: VFH ) 13.31% 17.03% Vanguard FTSE Europe ETF (NYSEARCA: VGK ) -4.72% -8.87% Vanguard Information Technology ETF (NYSEARCA: VGT ) 10.76% 56.76% Vanguard Health Care ETF (NYSEARCA: VHT ) 13.89% 18.99% Vanguard Dividend Appreciation (NYSEARCA: VIG ) 11.56% 12.58% Vanguard Industrials ETF (NYSEARCA: VIS ) 8.19% 10.34% Vanguard REIT Index ETF (NYSEARCA: VNQ ) 15.42% 8.44% Vanguard Mid Cap ETF (NYSEARCA: VO ) 9.45% 13.45% Vanguard Mid-Cap Value ETF (NYSEARCA: VOE ) 0.00% 65.22% Vanguard S&P 500 ETF (NYSEARCA: VOO ) 12.61% 18.06% Vanguard Mid-Cap Growth ETF (NYSEARCA: VOT ) 12.51% 17.34% Vanguard FTSE Pacific ETF (NYSEARCA: VPL ) 0.70% 0.84% Vanguard Utilities ETF (NYSEARCA: VPU ) 11.91% 18.33% Vanguard FTSE All-World ex-US Small-Cap ETF (NYSEARCA: VSS ) -4.07% -7.68% Vanguard Total World Stock ETF (NYSEARCA: VT ) -0.17% -0.32% Vanguard Value ETF (NYSEARCA: VTV ) 15.44% 16.83% Vanguard Growth ETF (NYSEARCA: VUG ) 12.48% 17.88% Vanguard Large Cap ETF (NYSEARCA: VV ) 6.49% 31.41% Vanguard FTSE Emerging Markets ETF (NYSEARCA: VWO ) -2.56% -2.77% Vanguard Emerging Markets Government Bond Index ETF (NASDAQ: VWOB ) -0.50% -0.58% Vanguard Extended Market Index ETF (NYSEARCA: VXF ) 6.96% 15.16% Vanguard Total International Stock ETF (NASDAQ: VXUS ) -4.43% -5.31% Vanguard High Dividend Yield ETF (NYSEARCA: VYM ) 11.67% 14.91% Vanguard Telecom Services ETF (NYSEARCA: VOX ) 4.56% 195.86% In the third quarter VTV was the only position that was over 10%. Now 14 ETFs have over a 10% return for the year. VNQ and VDC did the best this year. All the ETFs that are geared towards international stocks are in the red. It seems that every other country is still struggling. The energy sector is struggling too. VDE had the worst return and I lost over 6%. The number of positions that were negative from the third quarter to the end of the year went from 11 to 9. Looking at all my positions one can see why I didn’t do as well as the S&P. The S&P tracks the top 500 companies and is a good representation of the U.S. market. I have a lot of international positions and I already mentioned how all those were negative. Taking out those I would have had a return of over 12.5%. However, I am invested in those because I believe in diversification. Transactions: The fourth quarter was busy for trading. I had 72 trades which was more than the number of trades I had in the third quarter. Most of the trades were in the first few weeks of October as the market was dropping. I like to buy when everyone else sells and hold when everyone buys. I had a few major sells. I finished selling off all my positions in VCLT, BLV, and EDV. Interest rates were still low and when the market dropped in early October government bonds increased. I sold them and used most of profits to invest in VDE. The number of investments remained the same from the third quarter at 34. The chart below shows the ETFs that had more than a 2% weight. This is much different than the weights in the third quarter. The weights are more diverse. 20 ETFs are over 2%. VCLT was replaced by VDE as the highest weight. (click to enlarge) End of year comments: From looking back at my third quarter comments I stuck to my plan in the fourth quarter. When the market dipped at the start of October I was in buying mode and added to all my positions. From the middle of October to the end of the year the market went higher and I stopped trading and let the returns ride. I think overall my strategy worked out. This was the second best thing than to trading individual stocks. Most of my ETFs were positive. There were a few losers, but that’s how it goes. I was at the higher end of my 7-10% prediction. I didn’t expect the S&P to do a lot better, I thought I was closely tied to the market and that my portfolio should have tracked it almost perfectly. At the midpoint of the year my return was already up 9.77%. That means I was flat for the rest of the year. I expected much more at that point. 9.88% still beat 2 of the 3 benchmarks so I can’t be too disappointed. I think I am in a good position for the future. I think my positions in VDE and in the international ETFs will turn around next year. Since my portfolio did well there is nothing from deterring me from continuing the same strategy into next year. Now that you’ve read this, are you Bullish or Bearish on ? Bullish Bearish Sentiment on ( ) Thanks for sharing your thoughts. Why are you ? Submit & View Results Skip to results » Share this article with a colleague