Tag Archives: fn-start

Join Them If You Can’t Beat Them: Stop Picking Individual Stocks And Start Living An Easier Life

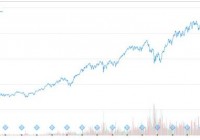
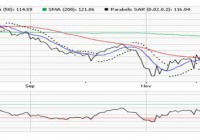
Summary The S&P has risen 171%. Time to start stock picking? Not necessarily. Let’s go back in time (15 years ago) to find a similar scenario, and let’s find out what John did. Our imaginary fellow investor from that time, John, made a decent amount of money by sticking to the plan and using common sense, while doing less and exposing himself to less risk. Since regular investors are really lagging behind, performing as good as the market is already setting you apart and makes you one of the top investors. My goal of today’s article was to figure out once and for all whether or not I should be going long – not by stock picking – but by buying an ETF of the S&P 500, so that I actually don’t have to do anything. If I had a dollar for every time I heard and read that “95% of individual investors don’t beat the market”, I’d have a lot of dollars. And yet still, while this seems to be a 100% accurate fact, I refused (until this point) to believe that I’m part of that 95% and hoped that I’ll beat the market over time. Does this make me an idiot or just a typical human being? I don’t know. But what I do know is that there are still a lot of stock pickers out there that are just as stubborn as me. 1 in 20 investors So once and for all, as you’re reading this, I hope you’ll realize that only 1 in 20 investors can select a portfolio of active funds that will outperform the market index over a 20-year period. That’s only a 5% chance of success, or a staggering 95% chance of failure. To put this in perspective: Being diagnosed with cancer in your lifetime: 1 in 2 for men, 1 in 3 for women Beating the house in a hand of blackjack: 1 in 2.2 A celebrity marriage lasting a lifetime: 1 in 3 Successfully climbing Mount Everest: 1 in 3 Living to 100 (if you’re 50): 1 in 8 Today’s article will answer a lot of questions for investing teens, investors in their twenties and even investors in their early thirties who are probably bothered by the same question: Should we be buying individual stocks that appear attractive/cheap after the 171% increase in the S&P 500? Or should we be afraid and wait for the next “big crash” before going long? Or should we just surrender to Mister Market no matter what, and start buying the index as a whole today through the oh-so simple S&P 500 ETF (NYSEARCA: SPY ) that follows the entire index, as we’ll be better off following the market in the long run? Let’s go back in time I believe that the only way to get a possible answer to this question is to present ourselves with a similar scenario where investors were probably also asking themselves the same thing, and then look at how things turned out for them if they had acted a certain way. In order to try and do this, I suggest we jump back in time. In fact, let’s jump back exactly 15 years ago to January 7, 2000. (click to enlarge) (Source: Yahoo Finance) The above graph is a representation of what investors were looking at, at that moment in time. SPY was up 215% since January 7, 1995, and was quoting at an all-time high. This reflects the current situation pretty damn well – if not better. (click to enlarge) (Source: Yahoo Finance) SPY is currently up 171% since its lowest point in February 2009, and is also quoting at an all-time high. So 15 years ago, I bet a lot of investors were wondering the same thing. Should we be stock picking? Or should we continue to follow the market. First of all, let’s just admit that deciding to get a position at an all-time high is never a pleasant occasion. It feels like shooting yourself in the foot. It feels like setting yourself up for losses. Especially when thinking about the typical sayings like: “Sell high, buy low” and “Be fearful when others are greedy and greedy when others are fearful”, which are clearly warning you not to get in at all-time highs after a 200% rally. Let’s meet John However, let’s just assume that one of our fellow investors (we’ll call him John for now) was ready to ignore all of his natural human responses/emotions and would just agree with the fact that 95% of individual stock pickers fail, and thus, that he is better off buying SPY no matter what. John feels that it is better to go with the market, “If you can’t beat them, join them”, right? Waiting for the next big correction before getting in seems to be silly, as no one knows when it’ll come. The strategy and situation of our imaginary investor John is the following: John just turned 20, and has decided that he wants to have a nice pension fund by the time he is 60, or perhaps have a nice pile of money by the time he is in his prime, let’s say, forty years old. This gives our investor friend a time horizon of at least 20 years, and when necessary, even 40 years. He then figures that he can miss at least $500 per month. John starts to deposit $500/month in SPY as of January 7, 2000, and will continue to do this at the beginning of each month. John is 35 Now, let’s take a look at how John’s simple strategy has played out so far – 15 years later. After 15 years, John has invested a total of $90.000 ($500 x 180) in the ETF, and the position seems to be worth $176.567,40 as of today. So without having to do anything special, except depositing $500 per month into the ETF (that was quoting at an all-time high when starting), he would have gained $86.567 if he were to sell today. (click to enlarge) John’s performance could have also been achieved if he would have chosen his stocks individually. However, he then needed to achieve an ~8.45% cumulative annual growth rate (see table below). Which is a rather hard thing to do for the average Joe in today’s market, right? ( Source ) Warren Buffett himself did only slightly better, growing Berkshire’s book value by 8.9% annually during the past 15 years. Thereby, let’s not forget that John has had 15 wonderful years. He never had to waste a single minute of his day in order to achieve this 8.45% annual growth rate. He never slept bad. He never worried that he would wake up and all his money would be gone. All he did was execute his simple plan. Let’s assume John is a smart guy Now, let’s assume that John is a smart guy like you and me, and that he tries to seize opportunities whenever they come along. So one day, he notices that his ETF is starting to drop due to the financial crisis. John thinks this is a temporary problem and decides to stick to the plan; in fact, he even tries to double his efforts, and decides to make a deposit of $1000 per month during 2009. (click to enlarge) By injecting an extra $6000 during the 2009 crash, John’s position is now worth a total $191.352,70, and has thus increased with $14.785 because of his extra efforts. John’s cumulative annual growth rate now lies at ~9.5% for the past 15 years, while doing nothing special except using his common sense. This is way higher than what average investors ( 2.6% ) have been achieving during the past 10 years. Conclusion Either you get a thrill out of proving others wrong and will try to actively beat the market – knowing that there’s a rather high chance you won’t beat it – or you’re just not bothered to achieve above-average results, and are happy with whatever the market does. However, as the average investor has achieved a 2.6% return for the past 10 years, and John has been able to scoop a 9.5% annual return by following the market, perhaps doing as well as the market has become an achievement of itself and is already making you special. Because of today’s analysis, I’ve decided to start depositing $500 into SPY each month as of now, as I feel that there is no downside in doing this in the long term. This way, some of my money will at least perform as well as the market. However, I will nonetheless continue to keep a portfolio full of individual stocks, as I also really enjoy investing actively. Even when this means that I’ll have a 95% chance of underperforming the market with this portfolio.

Positioning For An Oil ETF Rebound? Watch For Contango

Some may consider an Oil ETF to play a rebound in prices. Investors should consider the effects of the underlying market on a futures-based ETF. Potential alternatives to play a recovery in the oil market. As crude oil prices dip to fresh lows, contrarian traders are becoming increasingly antsy for a rebound. Traders may try to tap into an oil-related exchange traded fund to capitalize on a potential recovery, but one should first look under the hood and understand how the futures market can affect an ETF. For instance, many would likely turn to the United States Oil ETF (NYSEArca: USO ) , which tracks West Texas Intermediate crude oil futures, to play a potential turn in the energy market. USO is the largest and most popular oil-related ETF option on the market, with $1.2 billion in assets and $387 million changing hands daily, according to Attain Capital . However, oil traders should be aware that USO tracks front-month WTI future contracts and the underlying oil market is currently in a state of contango. Consequently, USO could experience a negative roll yield when rolling a maturing futures contract. Contango occurs when the price on a futures contract is higher than the expected future spot price, which creates the upward sloping curve on future commodity prices over time. Essentially, the phenomenon reflects a current spot price that is lower than the futures price. For instance, WTI futures were trading around $48.2 per barrel Tuesday for the February 2015 delivery, but contracts with a later delivery are trading higher, with contracts for December 2015 delivery at $55.1 per barrel. Commodity prices are typically higher in the future because people would rather pay a premium to have the commodity on a later date instead of paying the costs for storage and the carry costs for buying the commodity right now. While this phenomena is a normal occurrence in the futures market, contango can have a negative effect on ETFs. Specifically, ETFs that hold futures contracts sell the contracts before they mature and purchase a later-dated contract. In a contangoed market, the ETF loses money each time it rolls contracts to a costlier later-dated contract – the fund would technically sell low and buy high. Consequently, long-term investors may notice underperformance to the oil market since the ETF holds front-month contracts and would see a slight cost when rolling each front-month contract . According to Attain Capital: This is why USO has drastically underperformed the “spot price” of Oil over the past five years, with USO having lost -39% while the spot price of Oil went UP 48%. It is like an option or insurance premium – a declining asset with all else held equal. Alternatively, the PowerShares DB Oil ETF (NYSEArca: DBO ) and the United States 12 Month Oil ETF (NYSEArca: USL ) provide exposure to WTI oil, but include a different weighting methodology to limit the negative effects of contango. DBO can include contracts as far out as 13 months and dump contracts at any point. USL, on the other hand, ladders 12 months of contracts to diminish the effects of backwardation and contango. Additionally, Attain Capital suggests buying the energy industry ETF , such as the Energy Select Sector SPDR ETF (NYSEArca: XLE ) to capitalize on a potential rebound since companies have other factors that don’t relate to oil prices. More aggressive traders can fuel bets with leveraged energy funds, like the Direxion Daily Energy Bull 3X Shares ETF (NYSEArca: ERX ) , which takes the 300% performance of energy stocks on a daily basis. Investors can also look at the hammered alternative energy stocks, like Tesla (NASDAQ: TSLA ), which has been out of favor since lower oil prices make green energy plays seem less viable. The Market Vectors Global Alternative Energy ETF (NYSEArca: GEX ) and the First Trust NASDAQ Clean Edge Green Energy Index ETF (NasdaqGS: QCLN ) both include heavy tilts toward TSLA and other clean energy picks. Max Chen contributed to this article .

Any Hope For A Gold And Oil ETF Rebound In 2015?

Gold and oil were the two most-talked-about commodities last year thanks to their awful performances. These two widely-followed commodities witnessed dire trading in 2014 with the latter being thrashed heavily by the strength of the greenback, demand-supply imbalances, and cooling geo-political tension in the second half of the year. While muted global inflation, reduced demand from key consuming nations like China and India restricted the yellow metal’s northward ride, the return of worries in the Euro zone, and poor data points from Japan and China have made oil more diluted. As a result, oil prices plummeted more than 50% in 2014 and gold registered the first consecutive annual decline last year since 2000 . Some are also worried that the slump could continue as the Fed is now on its way to hike the key rate this year. The Fed’s step strengthened the dollar and in turn marred commodity investing. Great Start to New Year for Gold Having lost more than 8% in the last six months, SPDR Gold Trust ETF (NYSEARCA: GLD ) bounced back to start the New Year gaining about 2% in the last two trading sessions as of (January 5, 2014). So, did the biggest gold mining fund, Market Vectors Gold Miners ETF (NYSEARCA: GDX ) , which has added about 5.8% during the same phase. Gold miners – which often trade as leveraged plays on gold – delivered two successive years of negative performances losing about 50% in 2013 and 16% in 2014. A sagging stock market and worries over Greece political crisis indicating the nation’s likely way out of the Euro area bolstered the safe-haven appeal of gold to start this year. As a result, gold bullion crossed the $1,200/ounce mark after a few months. In such a situation, investors might want to know the upcoming course of gold related ETFs. We do not expect the latest uptrend to last long. Most of the macroeconomic indicators that went against gold prices last year like the Fed policy, strong U.S. dollar and deflationary spell, will nothing but intensify this year. GLD is trading a little below its 200-day simple moving average but higher than 50 and 9-day simple moving averages which signify long-term bearishness for the ETF. The biggest fund in the space, GLD, is yet to enter the oversold territory as depicted from the above chart. The ETF is trading at a Relative Strength Index (RSI) value of 53.48 indicating there is room for further erosion in the price once the risk-off sentiments drop out of sight. The trend was similar for GDX too with current price trading below long-term averages and above the short-and-medium term averages. Its RSI value stands at 56.54. In a nutshell, miners will likely follow the underlying metal’s direction, obviously with higher magnitude, this year. Overall, the gold mining space will likely see a mixed 2015 and will be busy paring down losses incurred last year. Investors interested to bet on gold should follow the space closely as it is expected to be on a roller coaster ride this year. No New Year Party for Oil Unlike gold, there was no celebration for oil this New Year. WTI crude prices are now below $50, marking a massive slide from their level a year ago. Needless to say, this was a new multi-year low. Persistent supply glut, no production cut by OPEC as well as the U.S. will keep the space under pressure. United States Oil Fund ( USO ) is trading a little below long, medium and short-term moving averages which signifies utter bearishness for the product. In fact, it seems as though oil does not have any driver which can revive it in the near term. However, the product is presently trading at a RSI value of 22.53 indicating that it slipped into oversold territory and might change its course soon after hitting a bottom. Per barrons.com , Citigroup’s commodity group cautioned about a frustrating 2015 for oil and slashed its oil-price forecast for this year and the next to even lower than its most bearish prior estimates. Citi cuts price expectation for WTI crude from $72/barrel to $55 in 2015 while Brent oil price expectation has been reduced to $63 a barrel from $80 a barrel. Bottom Line In short, 2015 should not be great for both commodities and the related ETFs barring some occasional spikes which can be defined as a correction. Investors dying to look for a sustained trend reversal in these commodities, should wait for a big Chinese and Euro zone stimulus, which may bolster the regions’ waning manufacturing industry spurring the usage of oil and goading investors to buy more gold (notably, China is the world’s largest consumer of the yellow metal). Investors should also look out for a pull back in oil production and the return of geo-political tensions. As far as the Fed rate hike is concerned, we believe that the most of it has been priced in at the current level, suggesting that either way, it will be another interesting year for oil and gold.