Tag Archives: fn-start

Closing The KYN-AMLP Pairs Trade

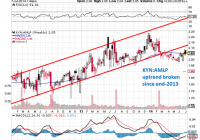
Six months ago, I suggested that investors buy Kayne Anderson MLP Investment Company due to its unusually large deviation from its historical premium/discount value. The KYN-AMLP pairs trade was in positive territory for nearly all of the trade, and actually reached +6% three months into the trade. As a hedged strategy, investors in the KYN-AMLP trade were insulated from fluctuations in the price of oil, but could still benefit from mean reversion in CEF premium/discount values. Six months ago, I made the case to buy Kayne Anderson MLP Investment (NYSE: KYN ) due to its abnormally large deviation from its historical premium/discount value. KYN’s strong outperformance over its benchmark, the Alerian MLP ETF (NYSEARCA: AMLP ), allowed the fund to maintain an average premium of 9% over the last five years. However, its lackluster price performance in early 2014 had caused the KYN to veer into discount territory, something that had not been seen since 2009. Given that KYN had actually outperformed AMLP on a year-to-date NAV basis at the time of the article, I reasoned that mean reversion would cause KYN to outperform its benchmark in the months ahead. Therefore, I suggested for investors to buy KYN (and to sell AMLP). Six months later, the KYN:AMLP ratio has barely changed. However, note that this trade was in positive territory for nearly all of the six months. Moreover, about 3 months into the trade, KYN had actually outperformed AMLP by nearly 6%. (click to enlarge) Part of this reason was due to the reversion of KYN’s discount to its historical mean. In other words, investors in KYN were benefiting simply through premium expansion rather than due to gains or losses of the underlying portfolio. The following chart shows the premium/discount of KYN in 2014 (graph reconstructed from data supplied by Kayne Anderson ). (click to enlarge) Therefore, an investor in the KYN:AMLP pair might have thought to harvest their profits in KYN as its premium reverted higher. While 6% in three months isn’t anything spectacular, keep in mind that this is was a pairs trade, meaning that it is essentially a market neutral strategy that limits downside risk. Moreover, it works out to be annualized profit of 24%, which is similar to the ETW-EXG pairs trade I presented previously. Obviously, both KYN and AMLP have done rather poorly over the past several months as the price of oil tanked. I won’t hide the fact that an investor who bought KYN at the time of publication of the article would be down around 5%. Yet, the investor who swapped his existing shares of AMLP for KYN would have done better than the investor who simply held on to AMLP. (Note that I wouldn’t recommend shorting AMLP outright due to the costs involved). KYN Total Return Price data by YCharts As I have described many times in previous articles, mean reversion of premium/discount values in CEFs is a way to add an extra layer of performance on top of your CEF holdings. Academic research supporting the notion of mean reversion in CEFs is abundant (e.g. here and here ).
Is 2015 The Year For Municipal Bond ETFs?

The U.S. muni bonds market had a great 2014 with its returns just below the S&P 500 and the Dow Jones Industrial Average. These two blue chip indices advanced a respective 15.3% and 11.5%. With the S&P 500 also crossing the 2,000 mark, muni bonds turned out to be the third best performing category gaining 8.7% (per Wall Street ), its three -year best. Needless to say, the $3.6 trillion muni bond market breezed past the 6.97% return generated by investment grade corporate bonds and 4.6% return delivered by the safe-haven U.S. treasuries. In fact, this outperforming corner of the bond market has not fallen behind even in a single month of 2014. This was in stark contrast to a lackluster performance in 2013 when the space crumbled thanks to poor financial health of Detroit and Puerto Rico as well as rising rate woes. Behind the Surge Municipal bonds are an excellent choice for investors seeking a steady stream of tax free income. Usually the interest income from munis is exempt from federal tax and may also not be taxable per state laws, making it especially attractive for investors in the high tax bracket looking to reduce their tax liability. Apart from investors’ desire for a tax-shelter, the demand-supply imbalance, improving fiscal health of many municipal bond issuers and a defensive sentiment prevailing in the market on sluggish global recovery made for a rewarding combination. As per Janney Montgomery , U.S. municipal-bond issuance will decline each year through 2017 to as low as $175 billion. Investor’s appetite for munis pushed the yields to multi-month lows. If this was not enough, the space is presently undervalued. A recent Bloomberg article stated that muni bonds almost reached the ‘cheapest’ valuation as compared to U.S. treasuries in 2014. The flight to safety mode led investors to grasp Treasuries quickly making munis an undervalued investment proposition. A Bet for 2015 Too With the deadline for income tax return filing coming closer, demand for municipal bonds should be on a roll in the New Year as well. Investors should note that munis are safer bets compared to corporate bonds and yield better than treasuries. With the Fed insisting to take a ‘patient’ stance on the rate hike issue, the higher yield nature of the munis should keep it in a straight up trajectory. ETF Plays Thanks to the muni boom, as much as $13.4 billion of assets were in muni ETFs’ as of September 30, an all-time high. Given the bright prospects of the muni space, let’s look at some of the top performing ETFs in the space. These could be a good way to target the best of the segment and these might be interesting selections for 2015 as well: Market Vectors CEF Municipal Income ETF ( XMPT ) This overlooked choice looks to track the S-Network Municipal Bond Closed-End Fund Index. The product is composed of shares of municipal closed-end funds listed in the U.S. that are principally engaged in asset management processes designed to produce a federally tax-exempted annual yield. Notably, closed-end products are best-suited for those who seek higher income. The product charges165 bps in fees and has mustered an asset base of $39 million. The fund is up 17.8% year to date and 0.6% in the last one month (as of December 31, 2014). The fund has a dividend yield of 5.58% as of the same date. SPDR Nuveen Barclays Build America Bond ETF ( BABS ) This is a long-term muni bond ETF and thus scored the best in 2014 thanks to the flattening of the yield curve. The product looks to track the Barclays Build America Bond Index, which is a division of the Barclays Taxable Municipal Bond Index. The product has amassed about $113.2 million in assets and charges about 35 bps in fees. The fund is up 21.3% this year and 2.23% in the last one month (as of December 31, 2014). The fund has a dividend yield of 3.61%. Market Vectors Long Municipal Index ETF ( MLN ) This fund looks to track the Barclays Capital AMT-Free Long Continuous Municipal Index. This Index intends to mainly measure the performance of long-duration U.S. muni bonds with nominal maturity of at least 17 years. Income from MLN is free of the federal tax burden and alternative minimum tax. The ETF has managed an asset base of about $93.5 million and has an expense ratio of 0.24%. MLN is up 17% so far this year and up 1.82% in the last one month. The fund has a dividend yield of 3.86%.

Utilities ETF: XLU No. 1 Select Sector SPDR In 2014

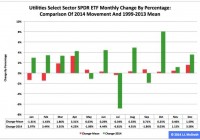
Summary The Utilities exchange-traded fund finished first by return among the nine Select Sector SPDRs in 2014. As it did so, the ETF posted the best annual percentage gain in its 16-year history. However, seasonality analysis indicates it could be facing a tough first quarter. The Utilities Select Sector SPDR ETF (NYSEARCA: XLU ) in 2014 ranked No. 1 by return among the Select Sector SPDRs that break the S&P 500 into nine chunks. On an adjusted closing daily share price basis, XLU rocketed to $47.22 from $36.68, a zooming of $10.54, or 28.74 percent. Accordingly, the ETF outdistanced its parent proxy SPDR S&P 500 ETF (NYSEARCA: SPY ) by an extraordinary 15.27 percentage points. (XLU closed at $47.35 Wednesday.) XLU also ranked No. 1 among the sector SPDRs in the fourth quarter, as it outpaced SPY by 8.28 percentage points. In addition, XLU ranked No. 1 among the sector SPDRs in December, as it outran SPY by 3.83 percentage points. Overall, XLU posted the best annual percentage return in its 16-year history: Its previous record was set in 2003, when it swelled 26.46 percent. XLU appears key to analysis of market sentiment based on the comparative behaviors of the Select Sector SPDRs . If XLU ranks near No. 1 by return during a given period, then I believe market participants are in risk-off mode; if XLU ranks near No. 9 by return over a given period, then I think market participants are in risk-on mode. Figure 1: XLU Monthly Change, 2014 Vs. 1999-2013 Mean (click to enlarge) Source: This J.J.’s Risky Business chart is based on analyses of adjusted closing monthly share prices at Yahoo Finance . XLU behaved a lot better in 2014 than it did during its initial 15 full years of existence based on the monthly means calculated by employing data associated with that historical time frame (Figure 1). The same data set shows the average year’s weakest quarter was the first, with a relatively small negative return, and its strongest quarter was the second, with an absolutely large positive return. The ETF’s October 8.03 percent gain was its sixth-highest monthly return ever. Figure 2: XLU Monthly Change, 2014 Versus 1999-2013 Median (click to enlarge) Source: This J.J.’s Risky Business chart is based on analyses of adjusted closing monthly share prices at Yahoo Finance. XLU also performed a lot better in 2014 than it did during its initial 15 full years of existence based on the monthly medians calculated by using data associated with that historical time frame (Figure 2). The same data set shows the average year’s weakest quarter was the first, with a relatively small positive return, and its strongest quarter was the second, with an absolutely large positive return. Clearly, this means there is no historical statistical tendency for the ETF to explode in Q1. Figure 3: XLU’s Top 10 Holdings and P/E-G Ratios, Jan. 7 (click to enlarge) Note: The XLU holding-weight-by-percentage scale is on the left (green), and the company price/earnings-to-growth ratio scale is on the right (red). Source: This J.J.’s Risky Business chart is based on data at the XLU microsite and Yahoo Finance (both current as of Jan. 7). In the wake of the sea change in bias at the U.S. Federal Reserve , away from loosening and toward tightening, XLU’s record-setting performance in 2014 kind of makes sense, at least in an equity market where share prices are primarily driven by the ebb and flow of asset purchases made by the central bank under one or another of its so-called quantitative-easing programs. It is worth mentioning in this context that the Fed announced the conclusion of purchases under its latest QE program Oct. 29 and that the ends of purchases under its previous two formal QE programs are associated with both a correction and a bear market in large-capitalization stocks, as evidenced by SPY’s dipping -17.19 percent in 2010 and dropping -21.69 percent in 2011. It is also worth mentioning that XLU’s big-time performance last year means that I, as a growth-and-value guy, see neither growth nor value in most of the utilities sector, as indicated by the above chart (Figure 3) and numbers released by S&P Senior Index Analyst Howard Silverblatt Dec. 31. At that time, Silverblatt pegged the P/E-G ratio of the S&P 500 utilities sector as 3.43. In the current environment, I therefore would be completely unsurprised should XLU continue to behave well in the current quarter, not on an absolute basis but on a relative basis (i.e., in comparison with the other Select Sector SPDRs and with SPY). On balance, the ETF may not produce gains, but it might produce losses smaller than those of its siblings. Disclaimer: The opinions expressed herein by the author do not constitute an investment recommendation, and they are unsuitable for employment in the making of investment decisions. The opinions expressed herein address only certain aspects of potential investment in any securities and cannot substitute for comprehensive investment analysis. The opinions expressed herein are based on an incomplete set of information, illustrative in nature, and limited in scope. In addition, the opinions expressed herein reflect the author’s best judgment as of the date of publication, and they are subject to change without notice.