Tag Archives: fn-start

Risk-Neutral Vs. The Real World: Wall Street Traders Really Are From A Different Planet

Risk-neutral versus real-world pricing and valuations matter. Risk-neutral traders are less active, leading to trading and investment opportunities. Interest rates drive growth and inflation expectations, not the other way around. Traders at the big Wall Street banks have their own culture, language, idioms and superstitions. They have a peculiar code of ethics, ideals and standards of behavior. Indeed, they even have unique and privileged access to markets and information that both ordinary and sophisticated investors are envious of. It is like they come from and inhabit a different planet from the rest of us. It turns out the traders at the big banks do, in fact, belong to another world. Readers of a quantitative inclination will recall that sell side traders operate in what is called the Q, or “risk-neutral” world, whereas the buy side – that means the rest of us – function in the P, or “real world.” The distinction between the two worlds – the P and Q – is profound, and is also gaining increased importance. That is because the Q World, occupied by the traders at the sell-side banks, is under intense pressure to reduce risk taking activities. There is also a culling of Malthusian proportions going on at Wall Street trading desks, in effect depopulating the Q World. The table below describes the differences between the two worlds: The P World The Q World Goal Predict the future Extrapolate the past Environment Real world probability Risk Neutral probability Process Discrete time series Continuous time martingales Dimension Infinite Finite Tools Econometrics, statistics Ito calculus, SDEs Challenges Parameter estimation Calibration Business Buy Side Sell side Density ratio or ∏ =q/p should be a monotonically decreasing function of market returns. Source: Meucci 2011, CGA Research. The key point to note here is that sell-side traders, or the Q-World, do not really need to worry about future market returns. The sell-side model is based upon a cost-plus replication strategy that simply buys and sells securities at prices where risk is neutralized by various hedging strategies. As long as markets are reasonably complete and liquid, the sell side can isolate itself against future price developments. The sell side only gets into trouble when it moves away from the Q-World and risks its own capital speculating in the P-World. Now that we understand the two worlds, the question becomes what happens when Q-World goes away or its market power is greatly diminished? We have already seen and heard about disruptions and lack of liquidity in various bond markets since Q-World retrenched in the aftermath of the 2008 financial crisis. More recently, we see the effects in the oil markets where an unprecedented exodus from commodity markets by the big banks has contributed to the drastic fall in oil prices. Is it simply a coincidence that headline oil prices have declined by upwards of 50% during the same time that Morgan Stanley (NYSE: MS ), JPMorgan Chase (NYSE: JPM ), Credit Suisse (NYSE: CS ), Goldman Sachs (NYSE: GS ) and others have or are planning to exit the commodity trading business? Maybe, but it is more likely that a reduced number of Q-World commodity traders has facilitated the decline. In years past, large market declines were typically met by sell side traders bundling distressed assets into packages of securitized products that were ultimately on sold to buy side investors. The banks once had a stabilizing influence upon volatile markets. Such activity is no longer profitable for the banks due to stringent capital requirements and some outright prohibitions against warehousing the risk. Unwittingly or not, the world’s central banks, led, of course, by the U.S. Federal Reserve, have supplanted the diminished role of Q-World traders by providing an ample dose of extraordinary monetary accommodation. In other words, secular volatility is set to rise and will be further exacerbated once the world’s central banks move to the side-lines. Few people, including myself, expect the days of hyper activist central banking to end anytime soon. Nonetheless, at the margin, even the U.S. Federal Reserve is a little less active then last year. So what are the implications? Secular volatility will rise in most assets classes, particularly those that trade over the counter e.g. government and corporate bonds Market corrections will be more violent, happen quicker and take longer to reverse than in years past Intrinsic value does not change, although cash flow value may- which will ultimately lead to an abundance of market opportunities Specifically, there are now opportunities to buy the SPDR S&P Oil & Gas Explore & Production ETF (NYSEARCA: XOP ) after it fell 30% in 2014. The PowerShares DB Com Index Tracking ETF (NYSEARCA: DBC ), also off close to 30% in 2014, offers investors greater exposure to a basket of commodities, although the ETF maintains significant exposure to oil. Timing such purchases is always difficult, and the risk of being too early is real. My point here is that such declines have as much to do Q- World inactivity as they do with fundamental changes to the supply demand equilibrium. Hence, a good portion of the recent drop should prove to be transitory. Investment success rests with those that can best understand the phenomenon of markets explained by basic economic mechanisms such as supply and demand and, which can also incorporate agent based models of behavior. There is little doubt that such agent based models such as the need to save for retirement, risk aversion or the savings and consumption patterns of millennials to name just a few, account for a large portion of the variance of asset returns. What has changed recently is the agent based conduct of the Q-World traders rather than any fundamental principle of economics. That leads to opportunities for P-World investors like you and me. The trick is to balance your assessment of both Type I errors – investing in an unprofitable strategy and Type II errors – missing a truly profitable trading opportunity. The likelihood of making a Type II error has increased simply because there are fewer Q-World traders willing and able to take the other side of market overreactions such as the mid October 2014 equity selloff, materially wider U.S. High Yield spreads and the ever lower Euro currency. Looking ahead to 2015, I think it is important to note just how important it is to get your interest rate call right. Last year, Utilities (SPDR ETF, XLU ), REITs (iShares Dow Jones US Real Estate ETF, IYR ), and high-quality, long-duration government bonds (iShares Barclays 20+ Yr Treasury Bond ETF, TLT ) had total returns close to 25% to 30%. These three asset classes benefited enormously from lower nominal and real U.S. interest rates. With interest rates in play again in 2015 (higher or lower), the difference between Q and P world pricing and valuation becomes even more important. It used to be that investors just had to get the growth and inflation call right, and the interest rate view would simply follow. That no longer seems to be the case. It’s a big deal, and it’s a theme that I plan to develop further in a future newsletter. Look at it this way. U.S. growth and inflation readings in 2015 are likely to be quiet supportive of risky assets. Yet the market’s attention is almost wholly captured by a potential rise, however modest, of the Federal Funds rate.
Watch Your Step When Using Bond Ladder ETFs

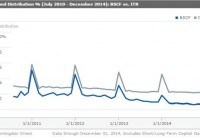
By Thomas Boccellari Institutional investors, such as insurance companies and pension plans, have long used their bond portfolios to match their interest and principal repayments with their cash flow needs. One way to accomplish this is to construct a portfolio of bonds with different maturity dates that correspond with the investor’s obligations. This is known as a bond ladder, and it can help mitigate interest-rate and liquidity risk. However, building a bond ladder can be expensive and time-consuming. Because bonds are traded over the counter, bid-ask spreads may be wide. Additionally, brokerage firms can charge high commissions for bond trades. Bond ladder exchange-traded funds can help solve some of these problems. Because bond ladder ETFs, such as Guggenheim Investment’s BulletShares and iShare’s iBonds, hold bonds from upwards of 100 different issuers, credit risk is more evenly spread around a portfolio. Further, because they don’t have lofty purchase minimums, like many bonds available through a broker, investors can get exposure to a variety of different bonds with very little capital. Strategies for Using Bond Ladder ETFs Within a Portfolio Suppose an investor knows that she will need to pay for a wedding and a down payment on a new home in one and three years, respectively. The investor may wish to set aside a certain amount of capital to pay for those future obligations. In the meantime, however, the investor would like to collect interest on her capital. If the investor buys a traditional bond mutual fund or ETF, she runs the risk of not getting back her original investment because of potential interest-rate movements that could push bond prices lower. To mitigate this risk, she could buy iShares iBonds September 2016 AMT-Free Municipal Bond (NYSEARCA: IBME ) and iShares iBonds September 2018 AMT-Free Municipal Bond (NYSEARCA: IBMG ) to match her portfolio’s maturity dates with her corresponding spending needs. This would allow her to collect income while getting her full investment principal back to pay for her obligations. Laddered bond ETFs also give investors better control over their portfolio duration, or interest-rate sensitivity. For example, suppose an investor wants exposure to investment-grade corporate bonds but is afraid that a traditional corporate-bond ETF, such as SPDR Barclays Intermediate Term Corporate Bond ETF (NYSEARCA: ITR ) , has too much exposure to bonds maturing between five and 10 years from now and is too exposed to interest-rate movements. To mitigate this risk, she could use Guggenheim BulletShares 2015/2016/2017/2018 Corporate Bond ETF (NYSEARCA: BSCF ) / (NYSEARCA: BSCG ) / (NYSEARCA: BSCH ) / (NYSEARCA: BSCI ) to give an overweighting to bonds with maturities of less than five years from now and reduce her portfolio’s overall exposure to interest-rate risk. Bond Ladder ETF structure Like an individual bond, a bond ladder ETF has a predefined maturity date. The fund can do this because it only buys bonds maturating in the year the ETF terminates. For example, Guggenheim BulletShares 2015 Corporate Bond ETF ( BSCF ) tracks an index that targets investment-grade corporate bonds maturing in 2015. The fund terminates (matures) on Dec. 31, 2015. At maturity, the fund’s assets are returned to investors. Because the fund has a predefined maturity date, it will behave differently from traditional bond ETFs. A traditional bond ETF targets a consistent range of bonds. For example, ITR targets U.S. dollar-denominated bonds with maturities between one and 10 years. During the fund’s monthly rebalancing, it will buy new bond issuances that have maturities between one and 10 years and sell bonds that no longer meet the maturity requirement. This keeps the fund’s duration relatively consistent. On the other hand, a laddered bond ETF only replaces bonds that are called. Otherwise, it holds securities until maturity or the fund’s termination date, which is usually in the same year that all of its bonds mature. This means that the laddered bond ETF’s duration will decline as the fund approaches maturity. While one would expect a laddered bond ETF to make consistent interest payments throughout its life, like an individual bond, this has not been the case. In fact, for funds within the BulletShares and iBonds families, monthly distributions have decreased at a similar rate to that of a traditional bond fund over the trailing five years through December 2014. Laddered bond ETFs’ inclusion of callable bonds could help explain this. Issuers can buy (call) back callable bonds if their price exceeds a predetermined level, which typically occurs when interest rates fall. The fund then has to replace these bonds with lower-yielding alternatives. Callable bonds are not the only problem. Companies have also refinanced their debt because of prolonged low interest rates. This has the same effect as when a bond is called. Further, if a bond matures, is called, or is redeemed after the final rebalancing, the bond is not reinvested in a corporate bond. It is instead kept in Treasury bills until the fund terminates. For Guggenheim BulletShares, the final rebalancing date is July 1 of the termination year. Therefore, if a bond matures, is called, or is redeemed after July 1 of the fund’s termination year, investors will lose more interest and not have the ability to reinvest their principal. This also means that investors won’t get back exactly their original principal plus interest because not all bonds are held until the fund’s maturity. At the start of 2014, BSCF had 285 bonds. By the end of 2014, 23 bonds dropped out because they were called or redeemed early. This had an impact on the fund’s distribution amount. Over the life of the fund, it saw its distribution percentage decline in a similar fashion to that of ITR. The difference in distribution percentage between BSCF and ITR is roughly equivalent to the difference in the funds’ expense ratios. Distributions are higher in December of each year because both funds include both the December and January distributions in December. Lastly, investors need to be aware of the additional costs associated with buying additional funds. If an investor decides to build a five-bond ladder, there will be at least five transactions. These costs can also increase if investors decide to roll their terminated ETFs’ assets into new funds. For investors who are comfortable with the structural risks of these funds, they are a cheaper, easier to build, and safer alternative to individual bond ladders. But traditional bond ETFs may be a better choice for investors looking for aggregate exposure to a particular type of bond or maturity range. Disclosure: Morningstar, Inc. licenses its indexes to institutions for a variety of reasons, including the creation of investment products and the benchmarking of existing products. When licensing indexes for the creation or benchmarking of investment products, Morningstar receives fees that are mainly based on fund assets under management. As of Sept. 30, 2012, AlphaPro Management, BlackRock Asset Management, First Asset, First Trust, Invesco, Merrill Lynch, Northern Trust, Nuveen, and Van Eck license one or more Morningstar indexes for this purpose. These investment products are not sponsored, issued, marketed, or sold by Morningstar. Morningstar does not make any representation regarding the advisability of investing in any investment product based on or benchmarked against a Morningstar index.

Falling U.S. Inflation Could Drive Up SLV

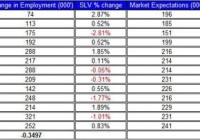
The price of SLV rallied by 5% during the year, up to date. Falling U.S. inflation may pull up SLV via the drop in U.S. treasury yields. The recent Non-farm payroll was inline with market expectations, but it didn’t drag down SLV. After losing nearly 8% during the last quarter of 2014, the iShares Silver Trust ETF (NYSEARCA: SLV ) showed some signs of recovery as its price added over 5% during this month. Even the strong results from the last non-farm payroll report didn’t curb down the price of SLV from picking up. Let’s review the relation among the developments in the U.S. labor market, inflation and the progress of SLV. The non-farm payroll report was published on Friday. It showed a 252 thousand of jobs added during December. Moreover, the previous two months were revised up by 50 thousand jobs. The rate of unemployment slipped to 5.6%. The table below shows the changes in SLV and the non-farm payroll results in 2014. Source of data taken from Bureau of Labor Statistics As you can see, the correlation between the changes in the gap between market projections and actual figures and the price of SLV is mid-strong and negative at -0.45 – this result suggests that as long as the number of jobs added doesn’t exceed market expectations, the price of SLV is likely to rally. Despite the recent rise of SLV last week, the ongoing recovery of the U.S. labor market doesn’t play in favor of SLV. This recovery, however, still has a long way to go until the U.S. labor market shows a full recovery – mainly in wages. Based on the recent report, hourly wages grew by only 1.7% on an annual pace. This is still a low level and remains well below the levels recorded before the 2008 economic meltdown. The other major report related to the U.S. labor market is the upcoming JOLTS report, which will be published this week. (click to enlarge) Source of data taken from Bureau of Labor Statistics Albeit the price of SLV doesn’t have as strong relation to the JOLTS figures as it does with the non-farm payroll. This is still an important report that could indicate the progress of the U.S. economy. The current estimates are for the report to show a 4.91 million jobs opening. The upcoming U.S. CPI and PPI, which will be released this week, could provide another measurement about the changes of the U.S. inflation. If the U.S. core inflation continues to slowly come down, this doesn’t vote well for rise in U.S. wages. The fall in U.S. inflation, however, could actually play in favor of SLV. At the very least, it may play this year in two roles when it comes to SLV. Usually, lower inflation tends to steer away investors, who fear of a potential spike in inflation, from precious metals investments such as SLV. The chart below presents the relation between core CPI and SLV during 2013-2014. Source of data taken from Bureau of Labor Statistics and Google finance Most of the drop in U.S. inflation was stemmed, as you well know, from falling oil prices. During the past few months, the correlation between SLV and oil prices was mid-strong and positive at 0.4. Albeit the price of SLV remained relatively flat, oil prices tumbled down by more than 40% in the past three months. So why falling oil prices could actually be good for SLV? As U.S. inflation falls, this is likely to reduce the odds of the FOMC raising rates. For now, the market still expects the FOMC to raise rates by the middle of the year. Alas, if U.S. inflation does tumble down, it could eventually influence FOMC members to reevaluate their policy. Finally, falling U.S. inflation is also likely to keep down U.S. long term treasuries yields, which tend to have a negative relation with the price of SLV. Therefore, falling long term treasuries yields driven, in part, by lower inflation provide the environment needed to keep pulling up SLV. For more see: Choosing Between Gold and Silver