Tag Archives: fn-start

Industrial ETF: XLI No. 6 Select Sector SPDR In 2014

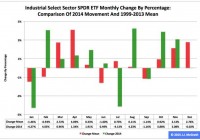
Summary The Industrial exchange-traded fund finished sixth by return among the nine Select Sector SPDRs in 2014. The ETF was especially strong in the fourth quarter of last year, when it advanced 7.06 percent. However, seasonality analysis indicates the fund could be weak in the first quarter of this year. The Industrial Select Sector SPDR ETF (NYSEARCA: XLI ) in 2014 ranked No. 6 by return among the Select Sector SPDRs that cut the S&P 500 into nine sections. On an adjusted closing daily share-price basis, XLI grew to $56.58 from $51.27, an increase of $5.31, or 10.36 percent. Therefore, it trailed its sibling, the Utilities Select Sector SPDR ETF (NYSEARCA: XLU ), and parent proxy, the SPDR S&P 500 Trust ETF (NYSEARCA: SPY ) by -18.38 and -3.11 percentage points, in that order. (XLI closed at $54.93 Tuesday.) XLI also ranked No. 6 among the sector SPDRs in the fourth quarter, when it behaved better than SPY by 2.16 percentage points and worse than XLU by -6.13 points. And XLI ranked No. 4 among the sector SPDRs in December, when it led SPY by 0.23 percentage point and lagged XLU by -3.59 points. Figure 1: XLI Monthly Change, 2014 Vs. 1999-2013 Mean (click to enlarge) Source: This J.J.’s Risky Business chart is based on analyses of adjusted closing monthly share prices at Yahoo Finance . XLI behaved better in 2014 than it did during its initial 15 full years of existence based on the monthly means calculated by employing data associated with that historical time frame (Figure 1). The same data set shows the average year’s weakest quarter was the third, with a relatively small negative return, and its strongest quarter was the fourth, with an absolutely large positive return. Consistent with this pattern last year, the ETF had a small loss in Q3 and a large gain in Q4. Figure 2: XLI Monthly Change, 2014 Versus 1999-2013 Median (click to enlarge) Source: This J.J.’s Risky Business chart is based on analyses of adjusted closing monthly share prices at Yahoo Finance. XLI performed worse in 2014 than it did during its initial 15 full years of existence based on the monthly medians calculated by using data associated with that historical time frame (Figure 2). The same data set shows the average year’s weakest quarter was the third, with an absolutely large positive return, and its strongest quarter was the fourth, with an absolutely larger positive return. It also shows there is a historical statistical tendency for the ETF to struggle in January. Figure 3: XLI’s Top 10 Holdings and P/E-G Ratios, Jan. 13 (click to enlarge) Note: The XLI holding-weight-by-percentage scale is on the left (green), and the company price/earnings-to-growth ratio scale is on the right (red). Source: This J.J.’s Risky Business chart is based on data at the XLI microsite and FinViz.com (both current as of Jan. 13). The World Bank Group became the latest economic observer to offer evidence of a slowdown in the growth of gross domestic product on this planet in the Global Economic Prospects report it released Tuesday. In its most recent semiannual report, the international financial institution based in Washington estimated GDP grew 2.6 percent in 2014, compared with its forecasts of 2.8 percent last June and 3.2 percent last January: Global growth in 2014 was lower than initially expected, continuing a pattern of disappointing outturns over the past several years. Growth picked up only marginally in 2014, to 2.6 percent, from 2.5 percent in 2013. Beneath these headline numbers, increasingly divergent trends are at work in major economies. While activity in the United States and the United Kingdom has gathered momentum as labor markets heal and monetary policy remains extremely accommodative, the recovery has been sputtering in the euro area and Japan as legacies of the financial crisis linger, intertwined with structural bottlenecks. China, meanwhile, is undergoing a carefully managed slowdown. Disappointing growth in other developing countries in 2014 reflected weak external demand, but also domestic policy tightening, political uncertainties and supply-side constraints. In its GEP report, the World Bank also cut its forecasts of GDP growth in 2015, to 3.0 percent from 3.4 percent, and in 2016, to 3.3 percent from 3.5 percent. The conditions underlying these cuts in the World Bank’s forecasts appear likely to have deleterious effects on the earnings of many of XLI’s constituent companies (i.e., those with major exposures to the global economy). This is especially so given the bias divergence in monetary policy at major central banks around the world and its impact on currency-exchange rates, as discussed in “PowerShares QQQ’s 2014 And Fourth-Quarter Performance And Seasonality.” At this late stage of the economic/market cycle, the valuations of XLI’s top 10 and other holdings seem unlikely to function as tailwinds for the ETF’s price appreciation in the foreseeable future (Figure 3). However, the numbers on the S&P 500 industrial sector reported by S&P Senior Index Analyst Howard Silverblatt Dec. 31 suggest it is not hideously overvalued, with its P/E-G ratio at 1.37: not cheap to the likes of me, not dear to the likes of normal people. Disclaimer: The opinions expressed herein by the author do not constitute an investment recommendation, and they are unsuitable for employment in the making of investment decisions. The opinions expressed herein address only certain aspects of potential investment in any securities and cannot substitute for comprehensive investment analysis. The opinions expressed herein are based on an incomplete set of information, illustrative in nature, and limited in scope. In addition, the opinions expressed herein reflect the author’s best judgment as of the date of publication, and they are subject to change without notice.
Junior Gold Miners Outperforming Other Asset Classes In 2015

Precious Metals and Junior Miners May Be Bottoming. Gold is breaking above critical 200 day moving average. Positive Trend Change in Gold? Oil and Copper Collapsing unable to deter gold rally. Stick to high quality gold mining assets in stable mining jurisdictions. For weeks I have been predicting that precious metals and the junior gold miners would bottom and outperform in January. Now gold (NYSEARCA: GLD ) is breathtakingly breaking above the key 200 day moving average and breaking four month highs as the World looks to gold as a safe haven. The intermediate to long term trend may be turning positive for gold and silver (NYSEARCA: SLV ) and unfortunately the amateur investor has already panicked out or may be covering their shorts. (click to enlarge) This breakout in gold could end the lower high pattern or downtrend. Sentiment is changing from negative to positive. Already for weeks , I highlighted the positive momentum in the junior gold miners (NYSEARCA: GDXJ ) despite the new low in December. This divergence usually signals an interim bottom and turning point. A few weeks ago precious metals and the shares were hitting new lows. The amateur investor panicked out. I told my subscribers to hang on and buy more at the bottom. Now the Junior Gold Miners are up over 14% since the beginning of the year outperforming the S&P500 (NYSEARCA: SPY ) and US dollar (NYSEARCA: UUP ). Despite oil and copper (NYSEARCA: JJC ) collapsing along with equities, precious metals and mining stocks (NYSEARCA: GDX ) appear to be bottoming and showing great relative strength. Right now, gold as a safe haven may be where the action is greatest. The US dollar may peak as investors realize that the US economy is still far from recovered. The oil and copper collapse is giving a loud shout to investors that the global economy is nowhere near recovery and looks more like the 2008 Financial Armageddon. One of the few things that can maintain its purchasing power in this sort of market is gold. Believe it or not another yellow metal which has held up well despite the 50% correction in oil is uranium. I told my subscribers at the end of 2014 that smart investors should be defensive against the overbought equities with inverse S&P500 ETFs such as Proshares Short S&P 500 (NYSEARCA: SH ) or a short financial fund (NYSEARCA: SEF ) and go long gold and junior gold miners in this sort of chaotic environment. The banks are sitting on major energy losses, while the S&P500 is made up largely of energy stocks and companies who profit off of emerging economies. It is way overbought and we could witness a powerful crash in equities that mirror the oil crash. I believe mining assets with real potential could come back into favor. I am accumulating hoping that within the next decade we could see a major run higher in this sector. Eventually, the trillions of debt will be paid back with devalued US dollars. Rising interest rates and inflation could pick up in 2015 especially in the US benefiting our beaten down wealth in the earth sector. Real gold mining assets in stable jurisdictions will go up in value. It is only a matter of time and patience. I like the junior gold miners especially the explorers now in Nevada and Quebec. Governments can print another trillion dollars by pressing a button at the printing press. This can’t be done in the gold exploration business. It takes years and a lot of divine blessing to find a million ounces of gold. Investors may now be able to believe this as gold breaks above the 200 day moving average. Now that you’ve read this, are you Bullish or Bearish on ? Bullish Bearish Sentiment on ( ) Thanks for sharing your thoughts. Why are you ? Submit & View Results Skip to results » Share this article with a colleague

SPY-TLT Universal Investment Strategy 20 Year Backtest

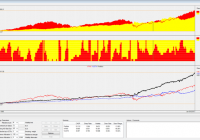
20 year strategy backtest using Vanguard VFINX/VUSTX index funds as a proxy for SPY/TLT. The strategy uses an adaptive SPY/TLT allocation, depending of the market environment. The strategy achieves 2x the return to risk ratio and a 5x smaller max drawdown than a buy and hold S&P 500 investment. In a previous article ” The SPY-TLT Universal Investment Strategy ” I presented a simple strategy which allowed to obtain an excellent return to risk ratio only by investing in variable allocations to the SPDR S&P 500 Trust ETF ( SPY) and the i Shares 20+ Year Treasury Bond ETF (NYSEARCA: TLT ) allocations. The allocation of the SPY/TLT pair is rebalanced monthly using a modified sharpe formula. For the new month, the strategy always uses the allocation ratio which achieved the highest modified sharpe ratio for a given lookback period. Here the algorithm uses a 72 day lookback period and a volatility factor of 2.5 in the modified sharpe formula: sharpe=72 day return/72 day standard deviation ^ 2.5. Several readers asked me now to present a longer backtest of this strategy. Using the Vanguard Five Hundred Index Fund Inv ( VFINX) and the Vanguard Long Term Treasury Fund Inv (MUTF: VUSTX ) as a proxy to the SPY/TLT ETFs, here is now a 20 year backtest for the UIS strategy. These index funds are only used to do the 20 year backtest. To run the strategy you would still invest using SPY and TLT. You can also use futures (ES/UB) or leveraged ETFs ( Direxion Daily S&P 500 Bull 3X Shares ETF ( SPXL)/ Direxion Daily 30-Year Treasury Bull 3x Shares ETF ( TMF) or Direxion Daily S&P 500 Bear 3X Shares ETF ( SPXS)/ Direxion Daily 30-Year Treasury Bear 3x Shares ETF ( TMV)) instead. This is explained in detail in my previous article. With these two Vanguard funds, this is now one of the rare strategies which can be easily backtested for such a long period. In general however, I think that it is much more important, how a strategy performed after 2008. The market has changed considerably during these last years, and if you would only invest in strategies which can be backtested 20 or more years, then you would have missed most of the investment opportunities of the recent years. For the backtest, I use our QuantTrader software. This software is written in C# and allows to backtest and optimize investment strategies using this sharp maximizing approach. You see the screenshot of the results below. The upper chart shows the VFINX/VUSTX performance. The middle chart shows the allocation with red=treasury and yellow=S&P500. If you look at this allocation, then you see that the market is in fact oscillating between “risk on” bull stock markets and “risk off” bear stock markets (= bull treasury market). Overall, you can say that for buy and hold investors, treasuries have been the better investment for the last 20 years. The sharpe ratio (return to risk) of the VUSTX treasury is 0.79, while the sharpe of the VFINX S&P500 fund is only 0.5. With VFINX/VUSTX combined, the strategy achieves a sharpe of 1.28, which is more than double the return to risk ratio of a stock market investment. This means, that instead of investing 100’000$ in the U.S. stock market, using leverage, you could invest 250’000$ in the UIS strategy. This way you would have the same risk, but you would get 20%-30% annual return. The strategy shows a very smooth equity line and the real max drawdown is well below 10%. The 11.68% drawdown peak measured in 2008 was in fact only an extreme mean-reversion reaction following a near 20% treasury up spike. The max drawdown is more than 5x smaller than a buy-and-hold stock market investment. Personally I think, this is in fact the biggest argument for such a strategy. All together, we had several major market correction like the 2000 tech bubble dot-com crisis, the 2001 9/11 attack, the 2003 Gulf war, the 2008 subprime crisis, the 2011 European sovereign debt crisis and lots of other smaller corrections. The UIS strategy always performed very well during these corrections. From 1995 to 2007, the UIS strategy had quite a stable 12% annual return. After 2008, the UIS return increased to 15% annually. The main reason for this improvement is the increased volatility and momentum factors present in the market. After the 55% correction of the U.S. stock market in 2008, VFINX had a lot to recover the last years. In fact, the normal average growth rate of the S&P 500 is about 9% and not 15% like it was during the last 5 years. The UIS strategy “likes” market corrections from time to time, because then the strategy can profit during the down market from treasuries going up and when the market goes up again, then the strategy can profit a second time from a higher stock market allocation. This way, the strategy can return more than each of the two single ETFs. If you want to check the monthly investments of this strategy, then you can download here the full backtest Excel file: 20 year performance log UIS VFINX VUSTX (click to enlarge) Source: Logical-invest.com