Tag Archives: fn-start

Market Timing Vs. Macro Decision Making

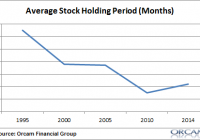
Here’s a very good post over at Brooklyn Investor on some of the differences between market timing and macro hedge funds. As more and more people become index fund investors I think these concepts become increasingly important to understand because all index fund investing is a form of macro investing (picking aggregates). But being an “asset picker” doesn’t make you a “market timer” in the sense that I think many people have come to think. First, market timers are people with extremely short time horizons. These are the people who think they can time the daily, weekly or monthly moves of the market. For some perspective, you can see how much the average holding period has declined over the years: If you go back even further in history the holding period used to be quite a bit longer (as high as 7 years). The crucial point in the discussion about how “active” an investor is really comes down to efficiency in decision making as opposed to “passive” vs “active” (since we’re all “active” to some degree). That is, we all deviate from global cap weighting, we all rebalance, lump sum invest, alter our risk profile, “factor tilt”, etc. Portfolio construction and maintenance is an active endeavor by necessity. The more important questions revolve around how we are optimizing frictions around our decisions. This comes down to two big points: Taxes will take between 15-38% of your profits. Reducing this friction is crucial. A tax aware investor not only uses the proper products to maximize after tax returns, but implements a portfolio that takes advantage of long-term vs short-term capital gains. Fees are the other big friction in a portfolio. As I’ve described before , the difference between using a 1% fee fund and a 0.1% fee fund over the long-term will result in tremendous outperformance: (The fee impact of $100,000 compounded at 7% with avg MF and low fee index) The smart macro investor knows that taxes and fees are a killer in the long-term. If the global financial portfolio generates a return of 7% per year then you can’t afford to be giving away 1% in fees every year and another 1-2%+ to the tax man every year. So here’s a safe rule of thumb – the difference between a “market timer” and someone who makes necessarily “macro decisions” (even if that’s just rebalancing, dollar cost averaging or making new contributions, etc) is 12 months and one day. Since taxes are such a large chunk of our real, real return then it makes sense to take a bit of a longer perspective. Rebalancing on a monthly or quarterly basis doesn’t add much value to your portfolio and increases fees & frictions significantly. At the same time, you have to be careful about the Modern Portfolio Theory concept of “the long-term.” As I described here , taking a “long-term” perspective could actually result in taking much more risk than is appropriate for you. Our financial lives are actually a series of short-terms within one longer time period so it’s best to treat your portfolio as a “savings portfolio” instead of a higher risk “investment portfolio”. As I’ve described in detail , we’re all active investors to some degree. We are all active asset pickers in a world where we all pick asset allocations that deviate from global cap weighting. That’s totally fine! So, the discussion really comes down to how efficient we are at picking our allocations and how we implement the process by which we manage that allocation. If you’re using a very short-term strategy that results in a holding period that is less than 12 months then I’d call you a market timer who is likely increasing your frictions and hurting your overall performance. If, however, you are making macro portfolio decisions in a more cyclical nature (over a year or several years on average) then you are a macro investor who is minimizing the negative impact of portfolio frictions. Of course, the discussion about how to efficiently or effectively we “pick assets” is a whole different discussion and opens up a whole new can of worms in the “active” vs “passive” debate….
Review Of Leveraged ETFs In 2014

Summary There exist important reasons for ETF decay. After analysis, ETFs and particularly 3X leveraged ETFs, continued to persist in 2014. 3X leveraged ETFs are less efficient in tracking an index or basket category of securities than their un-leveraged counterparts. Introduction Across the investment and financial academic community, ETFs have been heralded as the ideal investment for passive investors. While I do not deny the numerous positive benefits of investing in an ETF over individual securities for the average retail investor, I also point out an important flaw within ETFs: ETF decay. The decay of exchange-traded funds (ETFs), and by extension, exchange-traded notes (ETNs), has been a widely known phenomenon. Some quantitative traders have attempted to profit via statistical arbitrage by buying the underlying basket securities of an ETF and short selling the ETF in order to capture the ETF decay. In this article, I analyze the decay of 3X leveraged ETFs by 25 comparing ETF pairs. (As a side note, while I reference exchange-traded products as ETFs, the same can be said for ETNs.) Important Reasons for ETF Decay The reasons for the decay of ETFs and ETNs include the following: management fees, contango & backwardation in futures based on exchange traded securities, the compounded daily effect from resetting leverage and rebalancing a portfolio to mimic an index or basket category of securities, and higher volatility contributing to higher decay. Data Here are the 25 ETF pairs used to complete the analysis of 3X leveraged ETFs for the 2014 calendar year. By definition, an ETF pair is a group of bull and bear ETFs regarding the same underlying index or other basket category. Source: Data from Yahoo Finance, Analysis in Excel (click to enlarge) Source: Data from FactSet & Yahoo Finance, Analysis in Excel Summary Results of 3X Leveraged ETF Decay To begin with, after analyzing 25 ETF pairs, 3X Bull ETFs, on average, tend to have higher volatility and kurtosis than 3X Bear ETFs. 3X Bull ETFs, on average, tend to have lower skew than 3X Bear ETFs. Second, in theory, the ideal pair of a Bull and Bear 3X ETF has a correlation coefficient of -1. Intuitively, this makes sense; for example, if an index was up +1%, then a 3X Bull ETF would be up 3% and a 3X Bear ETF would be down -3%, where the 3X ETFs would be based on the same underlying index. By definition, a correlation coefficient must be between -1 and 1. As the correlation coefficient between a pair of a Bull and Bear ETF/ETN, increases, the efficiency of this pairing decreases and the ETFs/ETNs have a higher decay. 3X leveraged ETFs were less efficient and exhibited more decay than their unleveraged counterpart ETFs. Third, in theory, ignoring commission costs and other expenses, simultaneously buying (going long on) a bear and bull ETFs on an index at the same time, cost basis, and cost value should yield a zero profit situation. In reality, a zero profit situation does not exist; in 2014, by going long on both the bull and bear ETF on the same underlying index, the median rate of return was -7.4%. When adding up the percentage performance of a bull and bear ETF on the same underlying index, the greater the summation away from 0, the greater the inefficiency and decay factor for the ETFs. Furthermore, there is a strong correlation between higher ETF/ETN volatility and higher decay. Conclusion 3X ETFs and ETNs can provide investors with an extraordinary, leveraged opportunity to capitalize on their investment ideas. Important to note, gains and losses are magnified. Some ETF pairs, such as the ProShares Ultra S&P 500 ETF ( SSO) and the ProShares Ultra 20+ Year Treasury ETF ( UBT), can be pair traded by rebalancing every month, and this strategy can help increase an investor’s rate of return. In general, 3X funds are not built to be long term positions for investors. Overall, investing in 3X ETFs and ETNs is a volatile and incredibly risky decision due to the leveraged nature of these securities. Despite the decay of leveraged ETFs, this decay has decreased from the previous year, and these ETFs seem to offer a somewhat efficient method of investors to invest by diversifying across an index or basket category in a leveraged manner.

Protect Profits By Implementing A Risk Reduction Strategy

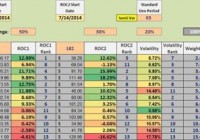
Improve Returns by Staying Out of Trouble. The Importance of Implementing a Circuit Breaker. Is It Working? Back-Testing Issues Explored. Portfolio return and risk are bound together, but there is a way to minimize losses most investors endure in long bear markets of the type experienced in 2008 and early 2009. How does it work? The sample portfolio described below is made up of ten randomly selected dividend aristocrat stocks plus the Vanguard Total Stock Market ETF (NYSEARCA: VTI ), and two treasury ETFs, the iShares 20+ Year Treasury Bond ETF ( TLT) and the iShares 1-3 Year Treasury Bond ETF ( SHY). VTI and TLT are included as references for equity and bond performance levels. SHY is critical as it is the “circuit breaker” ETF. In other words, reduce portfolio draw-down by staying away from securities that under-perform SHY. Investors will populate the ranking spreadsheet with their own holdings. The sample portfolio holds stocks and ETFs for demonstration purposes only. SHY is the exception as it serves as the ranking cutoff ETF. In the sample portfolio below, an investor holding these securities would sell off Johnson & Johnson ( JNJ), AT&T (NYSE: T ), Coca-Cola (NYSE: KO ), and Chevron (NYSE: CVX ) as these four stocks are ranked below SHY based on three metrics (these three metrics are defined in greater detail in prior Seeking Alpha articles ): Performance over the past 91 calendar days. Performance over the past 182 days. Volatility as measured by a semi-variance calculation. The investing model is as follows. Sell securities that are under-performing SHY based on a performance and volatility ranking model. Purchase the top ranked securities. Depending on how much one wishes to concentrate the portfolio the number of securities will vary. I prefer to work with ETFs so I will rank 10 to 15 Exchange Traded Funds and purchase two to five of them so long as they are ranked above SHY. If no securities are ranked above SHY, then hold the cash in a money market or invest in SHY as it is a low volatile security. (click to enlarge) I’m frequently asked, how well does this model perform when back-tested? Any investment model, when back-tested, is prone to all sorts of uncertainty. Here are a few that quickly come to mind. Stocks and ETFs are purchased throughout the trading day whereas back-tests use closing day prices. Price differences over a multi-year study add significant uncertainty into the final performance results. Many investors use limit orders so it may be days before a limit order is struck and there are times when the order is never placed. The start and end dates of a back-test has a major impact on the end performance results. When using ETFs for back-testing, many do not have years of historical data, thus crippling the results. In the above rankings, how many securities are selected for investment? If two work best in the study how can one be sure it will work out best going forward? Many back-tests “over curve-fit” only to deceive the reader. Is the model an anomaly that will disappear as more investors use it? Staying out of trouble has yet to be fully tested as this model has only been operational for less than one year. Nevertheless, the results are positive when working with ETFs that cover broad indexes such as U.S. REITs, Commodities, Gold, International Bonds, U.S. Bonds, U.S. Equities, International REITs, etc. I am tracking the performance of eleven portfolios, each with a different launch date. Each portfolio is reviewed every 33 days and the reviews are scattered throughout the month. Portfolios are analyzed to see if the performance at the end of each week is trending up or down based on the performance six weeks ago. For nearly every portfolio, those trends are positive. While results are reported each week, only trends over many months will answer the question – is this a valid risk reducing model? A “good” bear market will also help to answer the question.