Tag Archives: fn-start

Couch Potato Model Portfolios For 2015

Call off the hounds: I have finally updated my model Couch Potato portfolios for 2015. Full details appear on the permanent Model Portfolios page , but here are the new versions in downloadable PDF format: You’ll notice some significant changes this year: I have dropped the Complete Couch Potato and Über-Tuber from the lineup. All of the model portfolios now include only traditional index funds tracking the major asset classes: no REITs, real-return bonds, value stocks or small-cap stocks. The new lineup presents three options, with the key difference being the type of product. Option 1, from Tangerine , is a one-fund solution that’s ideal for investors who value simplicity. Option 2, the TD e-Series funds , offers more flexibility and lower cost. Option 3, built from Vanguard ETFs , is the cheapest option, but also the most difficult to manage for new investors. None of the options include ETFs traded on U.S. exchanges. Each option now includes several different asset allocations, ranging from a conservative (70% bonds and 30% stocks) to a aggressive (10% bonds and 90% stocks). The older model portfolios were all 40% bonds and 60% stocks, the traditional mix in a balanced portfolio. For each option and asset mix, we present performance data going back 20 years (1995 through 2014), compiled by Justin Bender . Since none of the funds has a track record that long, we have filled in the gaps using index data minus the MER of the fund in question. This is an imperfect but reasonable proxy for how an index fund would have performed. I thought long and hard about these changes, because I know many readers currently use one of the older model ETF portfolios. But it has now been more than five years since I launched this blog, and I have corresponded with hundreds of investors during that time. I’ve also worked directly with dozens more through PWL Capital’s DIY Investor Service . That depth of experience has given me a few insights. First, simple is usually better than complex. You can now build a portfolio that includes hundreds of bonds and thousands of stocks in some 40 countries using just three ETFs, all for a cost of less than 0.20%. No one needs to diversify more broadly than that. A skilled portfolio manager may be able to boost returns slightly by moving beyond traditional index funds in the core asset classes. But many DIYers make costly mistakes when they try to juggle too many funds. Meanwhile, there are exactly zero investors in the universe who failed to meet their financial goals because they did not hold global REITs or small-cap value stocks. Using U.S.-listed ETFs is a another example: the management fees and withholding taxes may be lower, but the steps involved in currency conversion can be complicated and it’s easy to make errors that wipe out any potential savings. If you don’t believe me, try explaining Norbert’s gambit to your mom. These model portfolios are not intended to reduce MERs and taxes to an absolute minimum. The suggested asset allocations were not created using Markowitz’s efficient frontier or portfolio optimization software. They are simply designed to provide broad diversification and low cost while remaining easy to manage on your own. So try not to agonize over the small details: just choose one of the model portfolios with an appropriate amount of risk and get started. It’s OK if convenience trumps cost, especially for young investors with small portfolios: remember, an additional cost of 0.10% works out to $0.83 a month for every $10,000 in your account. The cost of sitting in cash and scratching your head is much higher. And the peace of mind that comes with a simple investing strategy is priceless. Now that you’ve read this, are you Bullish or Bearish on ? Bullish Bearish Sentiment on ( ) Thanks for sharing your thoughts. Why are you ? Submit & View Results Skip to results » Share this article with a colleague
What Does History Tell Us About Consolidated Edison’s Valuation?

Shares of Consolidated Edison have previously traded at a valuation comparable to today’s mark. This article looks at what happened then, noting that while the P/E ratios are similar, today’s dividend yield is lower. In the end it comes down to your expectations, but it appears as though shares of ED are exchanging hands at the upper end of their historical range. Shares of Consolidated Edison (NYSE: ED ) increased in price by about 19% during 2014 — moving from $55.28 at the beginning of the year to $66.01 at year-end. If you add in dividends received, equating to $2.52 per share , your total return would have been roughly 24% — a full 10% higher than the S&P 500 index (NYSEARCA: SPY ). Despite the strong underlying business, this wouldn’t be something that you would expect moving forward. Utilities don’t routinely provide market-beating returns, at least not year-in and year-out. During the past 12 months the company reported earnings per share of $4 . With today’s share price around $68, this translates to a P/E ratio nearing 17, a dividend yield of 3.7% and payout ratio of 63%. The valuation approached similar levels during 2012 and 2013, but really you have to go back to 2007 to make a reasonable historical comparison — one or two years of history isn’t as telling as eight might be. At the end of 2006 the company reported adjusted earnings per share around $3 . During March of 2007, shares were changing hands around $51 resulting in a trailing P/E ratio near 17 — much like today. The dividends declared that year equaled $2.32, for a dividend yield of 4.6% and a payout ratio near 80%. Today the dividend yield and payout ratio is lower, but has a similar earnings multiple. So how did things end up for the investor of 2007, partnering with the company at a higher valuation and lower dividend yield than what was recently available? As previously mentioned, the stock price went from $51 to $66 — a 29% total increase or an annual increase of about 3%. Here’s a look at the dividends received: 2007 = $1.74 2008 = $2.34 2009 = $2.36 2010 = $2.38 2011 = $2.40 2012 = $2.42 2013 = $2.46 2014 = $2.52 Note that this particular investor would have missed a dividend payment in 2007 due to the March purchase date. In total you would have collected $18.62 per share in dividends for a total value of roughly $85 or a 6.8% annualized compound return. Earnings per share grew by nearly 4% over this time, while the dividend grew by just over 1% per year. Shares would have traded at roughly the same beginning and end P/E, which means the return was a function of earnings growth and an above average dividend. If the company is able to grow earnings and dividends by a similar amount moving forward, you might expect returns to be in the 6% to 8% range — quite reasonable for a slow growing utility with a steady eddy dividend. However, these assumptions are based on the same historical growth and the same future earnings multiple. Let’s look at different possibilities to get a better feel for where shares to stand today. Although Consolidated Edison has previously traded with a similar valuation as it does today — call it 17 times trailing earnings — it hasn’t traded much higher than this, at least not in the last few decades. So it wouldn’t be especially prudent to suggest that shares might trade at 22 times earnings next year or something of the sort. It’s possible, sure, but that wouldn’t be a particularly cautious expectation. Instead, you might imagine that an earnings multiple closer to 14 or 15 would be more appropriate — as has been the historical norm. Analysts are expecting intermediate-term earnings growth to be in the 2% to 3% range — let’s call it 3%. While the dividend could grow at a faster rate, the company’s recent history isn’t especially impressive in this regard. For illustration, let’s use a dividend growth rate of 2%. If the dividend per share were to grow by 2% annually, this could mean collecting 20% of your original investment in the form of dividends within five years. However, 3% earnings growth and future P/E of 15 would mean that the share price would effectively stagnant. As such, your total return expectation would be entirely dependent on the dividend resulting in roughly 4% returns on an annualized basis. Of course all of this is speculation — Consolidation Edison could grow much faster or even slower in the future. However, using information like this can better prepare you for making financial expectations. In a reasonably rosy “good case” an investor of today could see total annual returns in the 6% to 8% range. These returns are dependent on shares either trading with a higher than normal P/E ratio or else seeing the business perform better than expected. Your base case would be 3% to 5% yearly returns, effectively collecting the dividend payment along the way. This payment would be expected to grow — as it has for the last 40 years — albeit at a relatively slow pace. Finally, a downside case — say 1%-2% earnings growth and a 14 P/E — might indicate yearly returns of just 1%-2%. Whether or not today’s price is “too high” for Consolidation Edison is up to you, but keep in mind that its more difficult to “grow out of overpaying” for a slower growth utility. What does history tell us about Consolidated Edison’s current valuation? By starting with a higher earnings multiple, it’s possible to see reasonable returns in the future but not altogether prudent to expect them.

Middlesex Water: 42 Years Of Dividend Growth

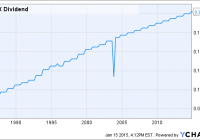
The shares currently sport a yield of about 3.5%. Utilities are notorious for being a great defensive play. Estimates for 2015 point to continued strong growth. Middlesex Water (NASDAQ: MSEX ) is a lightly followed water utility company based in New Jersey. The company operates in NJ as well as a couple of the surrounding states providing water related services. I found Middlesex while looking for attractive yields that are sustainable. Middlesex most definitely meets both of those traits. The company is worth a deeper look and at least an add to a watchlist. So the obvious first, the yield is nice at 3.5%. The company has had dividend growth for the past 42 years according to Dividend.com , most recently announcing an increase this past November. This increase puts the annual dividend at 77 cents a share with a current payout ratio of about 70%. While this may seem a bit high I don’t believe with a utility company like Middlesex it is something to be concerned with especially with the history of payments the company has. Below is the chart of the quarterly dividend growth since the late ’80s. Clearly other than the one disruption, which was for one quarter, there is a consistent uptrend. MSEX Dividend data by YCharts The company’s growth in general looks pretty as well. Both revenue and earnings have seen nice increases over the past few years and this trend also looks to be continuing. Year Revenue EPS 2013 $114.85M $1.03 2014 $117.29M(Est) $1.12 2015 $121.77M(Est) $1.19 (Sources for data and estimates: FT.com ) Using the estimates we see between 2013 and 2015 revenue is expected to increase another 6%, and EPS are expected to rise another 15.5%. EPS in 2015 of $1.19 would point to a payout ratio close to 64%, which means it will obviously practical for the dividend to be increased again. The great part about Middlesex is the fact that it is a great defensive play. There has been a crazy amount of noise that we are fast approaching a bear market with many companies way overvalued. I can’t argue with that last part. There are plenty of companies in this market overvalued. I also can’t say if there is a bear market coming or if there will just be a short-term correction. I do know that history tells us whatever the economic environment is Middlesex still performs well. The market has been up and down dozen of times in the past 42 years. Middlesex was still able to increase its dividend all those years. The fact is that water and water-related services will never go out of style. The barriers to entry are high so Middlesex doesn’t need to be overly concerned about competition as well. For a company that has done business since 1897 I don’t foresee any major problems anytime soon. In conclusion, I think Middlesex is a great play in a potentially rocky market. The yield is attractive at these levels and if the shares drop back a little more I think it would be a extremely good opportunity to pick some up. This year the company will celebrate its 118th birthday and likely increase its dividend for a 43rd year. Additional disclosure: Always do your own research before investing. Now that you’ve read this, are you Bullish or Bearish on ? Bullish Bearish Sentiment on ( ) Thanks for sharing your thoughts. Why are you ? Submit & View Results Skip to results » Share this article with a colleague