Tag Archives: fn-start

Bonds To Bring Stability To Our 1% Portfolio

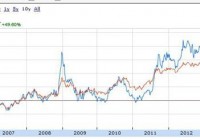
We are taking a bond position (low cost ETF) but not fully using our $180,000 allocated capital as bonds are too overbought right now. Hedging TIPS against US Treasury bonds is an option if you don’t want any to the corporate bond or short term bond sector. We now have $350k invested in our portfolio. Agricultural commodities are next on our radar. We have purposefully not invested in bonds thus far in our portfolio as I have been conducting extensive research into this area. To many, bonds are a boring vehicle as the returns are usually less than other asset classes. However they are vital in any portfolio as they bring stability and expectation as they are far less volatility than stocks. I am a firm believer that if you are approaching retirement, bonds should be a fundamental part of your portfolio and should outweigh your stock holdings. We have $180k to deploy in this asset class in our portfolio but we are not going to deploy all our available capital here just yet. Let’s go through this article and discuss why we are going to invest less and what bond vehicle(s) we are going to use in our portfolio. In a previous article, I spoke about portfolio re-balancing and position sizing in respective asset classes. I outlined that when an asset class becomes “Top Heavy” for us, we usually take some capital off the table and deploy that capital elsewhere in depressed sectors. Bonds have been on a glorious run for the past while with some analysts calling for a top anytime soon. Look at the charts below (10 year and 1 year) for (NYSEARCA: TLT ) and (NYSEARCA: IEF ) which are 20 and 10 year bond ETFs respectively. (click to enlarge) (click to enlarge) The 20 year bond has really outperformed recently with 28% gains in the last year alone which is extremely high for bonds. We do not want to deploy all our capital into this asset class just yet as I’m wary of the downside here. Nevertheless, the US bond bull may have many months and years to go as US dollar denominated funds are still seen as a safe haven by investors all over the world. We are not going to bet against the US government so $100,000 is going to be invested here instead of the allocated $180,000. So which bonds are we going to invest in? Let’s discuss. I looked first at “Treasury bills or T-bills”. These are short term instruments that don’t go beyond 12 months so they are essentially short term bonds. Next we have “Treasury notes” which mature from anything from one to ten years. These are good for income investors as the interest rate is fixed and you get interest payments every six months. Then you have our good old fashioned Treasury bonds, which are mid to long term (10 to 30 years). Finally we have TIPS, which are inflation adjusted. These bonds go up in value if inflation increases or down in value if deflation takes hold. TIPS are used by many professional investors as a hedge against long term treasuries. Long term treasuries usually fall in value (opposite to TIPS) when interest rates rise. This was an option I definitely looked at for our portfolio. However there are also corporate bonds where corporations pay you income in exchange for a fixed interest rate on your bond over a period of time. Blue chip US multinationals corporate bonds yield slightly higher returns than US Treasuries but since these bonds are related to equities, they also are more volatile. Another thing I am conscious of in our 1% portfolio is fees and commissions. Even though we are excellently diversified, we spend our fair share on broker commissions through the buying and selling of our underlyings. We currently have 40 positions in our portfolio and even though we have a very cheap broker, I hate giving money away. Also since bonds are far less volatile instruments than stocks, we will not be selling covered calls in this sector. The reward doesn’t justify the risk. Therefore I have decided to go with the Vanguard Total Bond Market ETF (NYSEARCA: BND ) and not go with multiple positions in this asset class. This asset class is to be our portfolio anchor. This ETF has returned 6% in capital gains over the last 5 years (see chart) and currently has a healthy 2% yield. What attracted me was the diversity (3000 US related bonds) and the expense ratio which is a very low 0.08%. (click to enlarge) So to sum up, we are investing $100k today into and holding for the medium to long term. If bonds start to lose value, then we have an extra $80k ready to deploy into this asset class if needs be. We now as of 20-01-2015 have in the region of $350k invested. (click to enlarge) Now that you’ve read this, are you Bullish or Bearish on ? Bullish Bearish Sentiment on ( ) Thanks for sharing your thoughts. Why are you ? Submit & View Results Skip to results » Share this article with a colleague
A Hedged ETF Strategy For Rising Interest Rates

The 10-year Treasury Yield at 1.8% is 1.2% below where it started 2014. Forecasts that rates would rise in 2014 were very, very wrong. With the 10-year yield now at a record low level, the probability of rising rates from here are better. Outlined below is a hedged strategy using short and long bond ETFs to profit from rising long term interest rates. In one of my accounts I hold about 20% in cash that I did not want to put into the equities market. My plan is to hold that money as available investment capital for the next time the equities market experiences a strong correction. In the current 0% interest on cash environment, I started to think about ways to put that money to work in a relatively low-risk way. I am also concerning about the effects of rising interest rates on the overall value of my income focused equity holdings. With the current level of interest rates paid on bonds, you need to take on quite a bit of duration to earn any meaningful rate of yield and I am unwilling to go 100% into a bond ETF with the prospects of higher interest rates somewhere in the not to distant future. In contrast, an inverse Treasury bond ETF will gain value when interest rates rise, but does not pay any income and will lose value if rates continue to decline. My research led me to try set up a combination investment of a bond ETF and an inverse Treasury bond ETF. The plan is to sell off the inverse ETF in stages as interest rates rise, reinvest the proceeds into the bond fund to generate a growing income stream from the bond ETF. The goal is to end up a few years down the road with the initial investment amount intact and all of the money in the bond ETF earning a higher yield than what is currently available in the market. Half of the cash in the account has been employed into this strategy. To put the strategy in play I initially selected the Schwab U.S. Aggregate Bond ETF (NYSEARCA: SCHZ ) and the ProShares Short 7-10 Year Treasury (NYSEARCA: TBX ) . SCHZ currently yields 2.03% with an average yield-to-maturity of 2.56%. Expenses are 0.06%. TBX is intended to provide a one-times inverse return of the Barclays U.S. 7-10 Year Treasury Bond Index and has expenses of 0.95%. Over the last year, the yield on the 10-year Treasury has declined by about 100 basis points (1.00%). For that period, the SCHZ share price appreciated by 4.50% and the TBX share price declined by 11.35%. With dividends reinvested for SCHZ you have roughly a 2 to 1 inverse return differential between TBX and SCHZ. Since I expect interest rates to increase over the next few years, my initial plan was to split the invested capital 40/60 between SCHZ and TBX. I started to leg into the two ETFs at the beginning of this year. At that time the 10-year Treasury carried a 2.12% yield, down 0.88% from where it started 2014. As the first two weeks of 2015 unfolded, the Treasury yield marched steadily lower. As the price of TBX dropped, I made two buy trades to establish an initial position. A point of interest, TBX is thinly traded and day only limit orders at or near the low end of the bid/ask spread typically get filled. When the 10-year yield dropped below 1.9%, I got more aggressive and I made two purchases of the ProShares UltraShort 20+ Year Treasury ETF (NYSEARCA: TBT ) , spread a week apart. TBT is a longer duration bond, leveraged ETF, so will change value at about 4 times the rate of TBX. With the 10-year yield setting record lows, I decided that there is an opportunity to make a relatively quick profit on an interest rate bounce off the 1.77% T-note yield bottom set on Thursday, January 15. Now with the full planned amount invested in the three ETFs, I am much more aggressively skewed towards rising interest rates than I initially planned. Here are the percentages invested in each ETF: SCHZ: 35% TBX: 48% TBT: 17% Currently, the total value of the three funds down 1.3% from the amounts invested. From this point, the plan is to profit from rising interest rates. As the share price of TBT rises, it will be sold off first with the proceeds invested into SCHZ. Even a modest rate climb back about 2% for the 10-year will turn this into a profitable trade. The SCHZ and TBX positions will be managed based on an expected slow 2-3 year rise in interest rates. Now that you’ve read this, are you Bullish or Bearish on ? Bullish Bearish Sentiment on ( ) Thanks for sharing your thoughts. Why are you ? Submit & View Results Skip to results » Share this article with a colleague

Adaptive Asset Allocation: Which Day Of The Month Is Best To Trade?

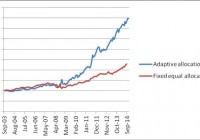
Summary The performance of adaptive asset allocation is sensitive to the day of the month when transactions are executed. The performance is better if the trades are executed around the end/beginning of the month than close to the middle of the month. The day of month effect is consistent for ETFs and related mutual funds. We obtained similar effects on (SPY, TLT), (VTI, AGG), (FSTMX, FTBFX), and (VTSMX, VBMFX) pairs. In a couple of recent articles , we demonstrated that a very simple and well-diversified portfolio may be made up of two instruments, one representing the total stock market and the other the total bond market. These portfolios are quite robust and achieve decent returns using simple strategies such as rebalancing and momentum-based adaptive allocation. At the suggestion of some readers, we investigate the effect of the day of month on the performance of the momentum-based adaptive asset allocation strategy. From many possibilities, I selected the following four portfolios: one built with SPY and TLT, the second with iShares and Vanguard ETFs, the third with Vanguard mutual funds, and the fourth with Fidelity mutual funds. ETFs portfolio: iShares 20+ Year Treasury Bond ETF (NYSEARCA: TLT ) and SPDR S&P 500 Trust ETF (NYSEARCA: SPY ). ETFs portfolio: iShares Core Total US Bond Market ETF (NYSEARCA: AGG ) and Vanguard Total Stock Market ETF (NYSEARCA: VTI ). Mutual funds portfolio: Vanguard Total Bond Market Index Fund (MUTF: VBMFX ) and Vanguard Total Stock Market Index Fund (MUTF: VTSMX ). Mutual funds portfolio: Fidelity Total Bond Market Index Fund (MUTF: FTBFX ) and Fidelity Spartan Total Stock Market Index Fund (MUTF: FSTMX ). For purposes of comparison, we simulate these portfolios from December 2003 to December 2014, a total of eleven years. The time period of the study was selected based on the availability of historical data of the investment instruments; AGG was created in September 2003. The data for the study were downloaded from Yahoo Finance on the Historical Prices menu for the eight tickers, SPY, TLT, AGG, VTI , VBMFX , VTSTX , FTBFX and FSTMX. We use the monthly price data from September 2003 to December 2014, adjusted for stock splits and dividend payments. The article has two parts. In the first part, we present general results for the four portfolios. The second part presents the effect of varying the day of the month when the trading is done. Part I. General Results The first study was done on the SPY + TLT. In it, we compare the results obtained with the following two strategies: (1) A portfolio with 50% SPY and 50% TLT without rebalancing. This portfolio is called “fixed allocation”. (2) A portfolio that is, at all times, invested 100% in either SPY or TLT. The switching, if necessary, is done monthly at the closing of the last trading day of the month. All the funds are invested in the instrument with the highest return over the previous 3 months. This portfolio is called “adaptive allocation”. The data below shows the investment results over 11 years (132 months). The first line is a buy-and-hold on SPY, the second is a buy-and-hold on TLT, the third is buy-and-hold of an initial investment of 50% in SPY and 50% in TLT, while the fourth line is adaptive allocation on SPY and TLT based on a look back of 3 months. Table 1. SPY + TLT portfolios January 2004-December 2014 Total Return% CAGR% Max DD% SPY 130.4 7.88 -50.79 TLT 126.6 7.72 -21.81 Fixed Allocation 128.5 7.76 -18.68 Adaptive Allocation 347.0 14.58 -17.13 The equity curves for the fixed and adaptive allocation of the SPY + TLT portfolios are shown in Figure 1. (click to enlarge) Figure 1. Equities of SPY + TLT portfolios Source: This chart is based on EXCEL calculations using the adjusted monthly closing share prices of securities. The second study compares the four pairs using the momentum-based adaptive allocation. The trading is done at the month’s closing prices. The results are given in Table 2. Table 2. Adaptive allocation of four portfolios January 2004-December 2014 Total Return% CAGR% Max DD% SPY + TLT 347.0 14.58 -17.13 VTI + AGG 241.6 11.82 -13.03 VTSMX + VBMFX 243.4 11.87 -13.81 FSTMX + FTBFX 214.8 10.99 -20.29 The equity curves for the three portfolios with adaptive allocation are shown in Figure 2. The Vanguard mutual fund was omitted because it virtually overlaps with the Vanguard ETF portfolio. (click to enlarge) Figure 2. Equities of portfolios with adaptive allocation Source: This chart is based on EXCEL calculations using the adjusted monthly closing share prices of securities. Part II. Day of Month Trading Results The study was done using the daily historical prices of the eight instruments. Because the results were very similar for the four pairs, we report mostly the results for the SPY + TLT pair only. The switching between bond and stock funds was done, if necessary, on the same day of the month. The look back period was three months, comparing prices on the same day of the month, but for three months apart. The day of the month is indicated by a variable called “shift”. Shift takes values between -16 and 6. Here shift=6 means the 6th trading day of the month, shift=0 means the last trading day of the month, shift=-1 means the trading day before the last trading day, etc. The equity curves for the SPY + TLT portfolio for three different trading days and with adaptive allocation are shown in Figure 3. As can be seen, the trading day of the month has a significant effect on the results. Trading on the last day of the month is better than trading on the 6th day of the month, but a little worse than trading seven days before the end of the month. These results are related to the specific historical data and cannot be generalized. (click to enlarge) Figure 3. Equities of the SPY + TLT portfolios with adaptive allocation Source: This chart is based on EXCEL calculations using the adjusted daily closing share prices of securities. To illustrate better the variability of the performance of adaptive allocation with the trading day of the month, we show the scatter plots of CAGR and DD versus the shift values from -16 to 6. (click to enlarge) Figure 4. CAGR% of the SPY + TLT portfolios with adaptive allocation Source: This chart is based on EXCEL calculations using the adjusted daily closing share prices of securities. As can be seen in Figure 4, CAGR varies very little for shift values from -5 to 5, but decreases substantially for shift values outside this range. (click to enlarge) Figure 5. DD% of the SPY + TLT portfolios with adaptive allocation Source: This chart is based on EXCEL calculations using the adjusted daily closing share prices of securities. As can be seen in Figure 5, DD varies very little for shift values from -16 to 4, but increases somewhat for shift=6. Conclusions The day of the month when the trading is done affects the performance obtained applying the adaptive asset allocation strategy. The performance is better if the trades are executed around the end/beginning of the month, than close to the middle of the month. The day of month effect is consistent for ETFs and related mutual funds. It may be useful to extend this study to various portfolios with instruments from other asset classes.