Tag Archives: fn-start

Gain Exposure To U.S. Infrastructure Boom With GII

Summary Poor American infrastructure has an overall Grade of D+ by American Society of Civil Engineers. Congested roads alone cost America $101 billion in fuel and wasted time in 2010 and last major infrastructure work was in 1956 by President Eisenhower. President Obama called for greater infrastructure work in his 2015 State of the Union Address and is expected to push for wider infrastructure development. GII is a global infrastructure ETF loaded with world class infrastructure companies that are likely to be called to service in the upcoming infrastructure upgrade. Investors can add a small position of GII before adding to it. America’s Infrastructure Investment Opportunity The American Society of Civil Engineers (ASCE) is the premier organization with expertise on infrastructure works in America founded since 1852. ASCE produces a grading score of condition and performance American infrastructure every 4 years and the latest report published on 2013 was given an overall grade of D+. Their grading system follows the typical school grades where A represents Excellent, B represents Good, C represents Mediocre, D represents Bad and F represents failing. So American infrastructure is only 1 grade above failure and graded as bad. Before we go further in the economic implication of this state of disrepair for American infrastructure, let us have an idea of the scope of infrastructure by the grades of the categories of Water and Environment, Transportation, Public Facility and Energy below. (click to enlarge) Source: American Society of Civil Engineers ASCE has estimated that America requires $3.6 Trillion of infrastructure investment by 2020 to meet the infrastructure needs of America. This represents a huge investment opportunity which we can tap into through a diversified holding of infrastructure related companies through an Exchange Traded Fund (NYSEMKT: ETF ) which will be recommended at the end of this article. Cost Poor Infrastructure We will use the transportation category with roads in particular to illustrate the cost of poor infrastructure. We are all familiar with traffic congestion during rush hour where we are forced to endure hours on the road. This is a very real life example of the cost of poor infrastructure works. It is estimated that an average of 34 hours spent waiting on roads and burning 1.9 billion gallon of oil costing motorists $101 billion in 2011. 42% of America’s major urban highways remains congested and 32% of major America’s roads remain in poor or mediocre condition. (click to enlarge) This is the result of steadily falling investments on transportation as seen in the chart above. President Obama prevented a temporary boost by adding provisions for transportation investment in the 2009 Recovery Act but they were a short term boost and have since been depleted. Overall they are not sufficient to reverse the aging roads of America. The last major infrastructure work was done 59 years ago when President Dwight Eisenhower signed the Federal Aid-Highway Act of 1956 , which added 41,000 miles of interstate highways that linked different states of America together. It was completed in 1980 and represents 1% of road network in America but it carries 23% of all railway traffic. It was heralded as a major achievement at that time but 35 years later more funds are needed to maintain this vast network of roads. Obama Calls for Action During the State of the Union Address on 21 January 2015 before Congress, President Obama made the following rallying call for the United States to upgrade its failing infrastructure. “21st century businesses need 21st century infrastructure – modern ports, stronger bridges, faster trains and the fastest internet. Democrats and Republicans used to agree on this. So let’s set our sights higher than a single oil pipeline. Let’s pass a bipartisan infrastructure plan that could create more than thirty times as many jobs per year, and make this country stronger for decades to come.” There are various laws that can make this happen including the popular Transportation Infrastructure Finance and Innovation Act (TIFIA) which can be expanded further and modernizing the Federal Financing Bank (FFB) to allow for greater Public Private Partnership (NYSE: PPP ). Australia’s experiment with PPP in the 1990s should be instructive to benchmark expectations of return. Primary infrastructure returned a yield of 7%-8% and secondary infrastructure returned 13%-15%. Obama tried to make transportation infrastructure a priority in 2014 and we expect him to build on his momentum of an improving economy to try again this year in 2015. With third quarter economic growth of 5% at 11 year high, we expect Obama to seal his legacy with a wide range of infrastructure works. Infrastructure ETF Capital protection is the key word for investors and this can be achieved by investing in a diversified portfolio of stocks that an exchange traded fund ( ETF ) can provide. The SPDR S&P Global Infrastructure ETF (NYSEARCA: GII ) includes world class infrastructure companies that are likely to be called upon to build the US infrastructure. The top companies in this ETF include Transurban Group ( OTCPK:TRAUF ) (5.13%), Atlantia ( OTC:ATASF ) (4.14%), Duke Energy Corporation (NYSE: DUK ) (3.54%), Enbridge (3.43%) and Abertis Infraestructuras SA ( OTCPK:ABRTY ) (3.36%). I would provide a brief description of these companies for investors to have an understanding of the types of companies that they are gaining exposure with GII. Transurban manages and develops urban toll road networks in Australia and North America. Atlantia is an Italian company that constructs and operates toll roads. Duke Energy, headquartered in Charlotte, North Carolina, is the largest electric power holding company in the United States. Enbridge is an energy delivery company based in Canada specializing in the transport and distribution of crude oil, natural gas, and other liquids. It has 41.79% weighting in Utilities, 39.79% in Industrials, 17.67% in Energy and 0.76% in Basic Materials. Abertis is a Spanish company that operates motorways in Europe and airports in cities like London and Orlando. (click to enlarge) We can see that GII has been ranging from $47 to $49 past 2 weeks and recent price action have a bullish slant to it. GII is decently priced at with 19 times price earnings and it has a market capitalization of $111.73 million and volume of 2,592. Investors can consider taking a small exposure of GII and look out for further action on the Obama Administration before adding to their position.

Fire Your Investment Manager: A Refined All-Long Strategy IV

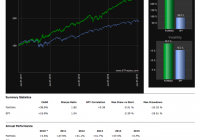
The strategy has been further improved. We use multiple markets for both return generation and hedging. This improves returns in relation to risk. The strategy can survive shocks in both the equity and the fixed income markets. Here are the refined strategy’s rules: 1. Buy SPXL (NYSEARCA: SPXL ) with 40% of the dollar value of the portfolio. 2. Buy ZIV (NASDAQ: ZIV ) with 20% of the dollar value of the portfolio. 3. Buy TMF (NYSEARCA: TMF ) with 35% of the dollar value of the portfolio. 4. Buy TVIX (NASDAQ: TVIX ) with 5% of the dollar value of the portfolio. 5. Rebalance annually to maintain the 40%/20%/35%/5% dollar value split between the positions. Here are the strategy’s results in a log scale: (click to enlarge) The strategy’s performance is outstanding. During the test period, it beats the market by over 20 percentage points per year, while enjoying a lower max drawdown. We can understand how the refined strategy accomplishes this by breaking down the strategy into its return-generating components and its hedging components . Synthetically selling Mid-Term Volatility and holding a leveraged S&P 500 position create the return-generating components of the strategy . Then, holding a leveraged Long Bond position and holding a leveraged Short-Term Volatility position create the hedging components of the strategy . The refined strategy uses multiple markets for both return generation and hedging, smoothing returns, and increasing the strategy’s robustness to shocks in both the equity and the fixed income markets. The net result is outstanding. This strategy index would be perfect for an ETF provider which wishes to launch a product which can beat the SPY even in a bull market, while also enjoying moderate correlations to both equities and fixed income. During the recent stock market confusion, the strategy has really hit its stride. The last 12 months: (click to enlarge) The last 6 months: (click to enlarge) The last 3 months: (click to enlarge) 2015 YTD: (click to enlarge) The sharpe and CAGR/Max Drawdown ratios just destroy the performance of the S&P 500. When faced with this type of technology, I cannot understand why anyone would want to invest in conventional stock picking funds or traditional asset allocation regimes such as risk parity. The strategy powers through market chop. The index is hedged multiple ways, unlike most strategies which solely rely upon bonds as the hedging component. That’s why the strategy has a low correlation to both stocks and bonds. It has volatility exposure in order to help achieve absolute returns during market dislocations. We believe that our more advanced strategies should replace most equity/bond/commodity mixes, since they are empirically safer. And after a multi-decade bond bull market, hedging using multiple markets is the responsible thing to explore.

Best High-Yield Bond Funds For 2015 – Part 3

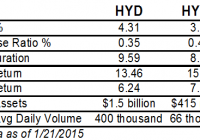
Summary HYD has a higher yield and lower credit quality. HYMB has higher credit quality and better total return history. HYMB has large exposure to California. In part one , we compared the two largest high-yield bond funds: iShares iBoxx $ High Yield Corporate Bond (NYSEARCA: HYG ) and SPDR Barclays Capital High Yield Bond (NYSEARCA: JNK ). In part two , we compared two short-term high-yield bond funds: PIMCO 0-5 Year High Yield Corporate Bond (NYSEARCA: HYS ) and SPDR Barclays Short Term High Yield Bond (NYSEARCA: SJNK ). In part three, we will look at the offerings in the high-yield municipal bond space: SPDR Nuveen S&P High Yield Municipal Bond (NYSEARCA: HYMB ), Market Vectors High-Yield Municipal Index (NYSEARCA: HYD ) and the much newer Market Vectors Short High-Yield Municipal Index (NYSEARCA: SHYD ). Index & Strategy HYD tracks the Barclays Municipal Custom High Yield Composite Index while HYMB tracks the S&P Municipal Yield Index. HYD was created in February 2009, HYMB in April 2011. These two funds have a correlation of 0.9836. On the expense ratio, HYMB has an asterisk because it is currently subsidized through October 31, 2015. Without the subsidy, the expense ratio would be 0.50 percent (the yield would also dip 0.05 percent). On volume, HYD’s price is half that of HYMB, so dollar volume is about three times higher for HYD. HYD has a higher yield, lower expenses and longer average duration. As we’ve seen when comparing other high-yield ETFs, total returns have favored the funds with shorter durations, lower yields and higher credit quality. As for the latter, HYD has 30 percent of assets in BBB rated debt; 22 percent in BB; and 17 percent in B. HYMB has superior credit quality, with 21 percent of assets in A rated debt; 22 percent in Baa; and 33 percent below Baa. Both portfolios have about one-quarter of assets in unrated debt. Both funds give a geographic breakdown of their assets as well. HYMB has 14.2 percent of assets in California, while HYD has only 8.9 percent in the state. HYMB’s next largest state is Texas, with 7.5 percent of assets, while HYD’s second largest holding is NY with 8.5 percent of assets. One other option out there is Market Vectors Short High-Yield Municipal Index. The fund tracks the Barclays Municipal High Yield Short Duration Index. It has an expense ratio of 0.35 percent and a yield of 3.10 percent. It has a duration of 4.17 years. The fund is overweight Texas, at 10.5 percent of assets. Credit quality is 48 percent in BBB rated debt; 16 percent in BB; 10 percent in B; and 2 percent in CCC. It has higher credit quality than HYD. The fund has only $80 million in assets and trades about 20,000 shares per day. SHYD had only one year of history, with an inception date in January 2014. Performance The price ratio chart of HYD and HYMB shows HYD in a persistent downtrend, signifying under performance. However, there are two clear periods when HYD outperformed: summer 2011 and summer 2013, while under performing in July 2014. (click to enlarge) Summer 2011 was a period when investors worried about sovereign debt in the U.S. and Europe, getting to the point where people were discussing a U.S. Treasury default. In summer 2013, Detroit declared bankruptcy , while in summer 2014, Puerto Rican bonds sold off sharply. This shows that the portfolios have deviated substantially when volatility increases. A performance chart shows that only the Detroit bankruptcy led to significant price declines. (click to enlarge) Income HYMB has a 30-day SEC yield of 3.83 percent versus HYD’s 4.31 percent yield. As has been the case with other high-yield funds, falling interest rates have weighed on the fund’s payouts. (click to enlarge) Risk & Reward Compared to the Barclays Municipal Index, HYD has a beta of 1.50 and HYMB has a beta of 1.61. Investors are taking on more market risk with these funds as compared to aggregate muni bond funds and the beta reflects this. The Barclays Municipal Index has a standard deviation of 3.72. HYD has a standard deviation of 6.24 and HYMB a standard deviation of 6.42. These standard deviations are higher than any of the junk bonds previously covered in parts one and two. This is due to the volatility surrounding Detroit’s bankruptcy in 2013. High-yield corporate bonds have enjoyed a smoother ride over the past three years and this is reflected in their lower standard deviation. Bloomberg’s ranking of states by their underfunded pensions shows a wide gap between the states when it comes to financial management. Between HYD and HYMB, the one state that sticks out is California. While most state exposure is similar, California accounts for 5 percentage points more of HYMB’s assets. Investors with a strong opinion on California’s long-term finances can opt for one fund over the other, but for other states, single state exposure is not as large a concern. Conclusion Municipal debt is not out of the woods because unfunded liabilities will eventually become a public debt if the municipality doesn’t go bust first. In the long-run, that favors HYMB’s superior credit quality-assuming California isn’t one of the problem states in the future. As for 2015, municipal bonds appear to be in good shape. Investor interest in municipal bonds recovered in 2014 after a drop in 2013. The Federal Reserve Z1 report shows municipal debt was $2.999 trillion in 2009, and as of Q3 2014, that number fell to $2.908 trillion. State and local governments have been slowly repaying their debt, leaving many states in a stronger financial position than they were six years ago. Liabilities such as unfunded pensions are a concern in states that haven’t addressed the problem, but overall the supply of muni debt has stayed constant as the economy has grown. While the municipal bond market looks attractive next to corporate junk bonds in terms of risk/reward, PIMCO 0-5 Year High Yield Corporate Bond (covered in part two) appears more attractive for 2015 given it has declined since the summer along with high-yield corporate bonds. If the economy stays strong in 2015, HYS is likely to recover and deliver some capital appreciation. It lacks energy exposure, which could struggle if the U.S. dollar continues its rally in 2015, and that could help it beat other high-yield bonds funds this year.