Tag Archives: fn-start

Why Muni Closed-End Funds May Not Do Well In 2015

Summary CEF Muni funds from 1995 to 2014 that show in 2007 and 2011 that highest number has gone down 2 to 3 years to the lowest number. High-Leveraged and Low Leverage, what is the difference? Hedge Funds for municipal bonds. European Central Bank : Since the financial crisis in 2008, the U.S. Federal Reserve, the Bank of England (BOE), and the Bank of Japan (BOJ) have each utilized quantitative easing. Then on Thursday January 22, Mario Draghi revealed that the European Central Bank (ECB) plans to purchase over €1 trillion ($1.157 trillion) in European public and private sector bonds by the fall of 2016. This means purchasing €60 billion a month of government bonds, debt securities issued by European institutions and private sectors bonds. Though the jury is still out regarding the effectiveness of such measures, as of now it is “all over, but for the shouting”. While this policy is expected to push down European yields, rates in the U.S. will likely be moving in the other direction by year-end. So, what does all of this monetary policy mean for CEF Municipal Bond Funds? (click to enlarge) CEF Strategies from 1995 to 2014 : GrowthIncome has provided a table below plotting the annual performance for 11 Closed-End Fund sectors from 1995 to 2014. Each column is ordered from best to worst annual performance. This table also contains a line connecting the position of the MuniBndFnd (Municipal Bond Funds) sector for each year. As you see, MuniBndFnds fund types have its year-to-year rankings both above-and-below its previous year-as with all other fund types strategies As you can see in the left most column of the chart, the MuniBndFnds sector provided the best returns during 2014. MuniBndFnds were also at the top of the list in 2007 and 2011. Yet, in subsequent years (2008 and 2012), the sector plunged from number 1 to number 6, and then even further to the bottom of the pile within the next 2-3 years (2010, 2013). So, if history is any indication, it would be wise to take a closer look at MuniBndFnds after it was the best performing sector the year prior. Municipal Closed-End Funds : There are approximately 181 municipal (national and state) Closed-End funds. On average, MuniBndFnds are leveraged at 33.7%, have a 5.5% tax-free yield, a discount of -6.6%, and a 1.1% baseline fee. The market cap average is $327 million. MuniBndFnds: High & Low Leveraged: To understand this sector a bit better, GrowthIncome has put the 5 highest leveraged funds and the 5 lowest leveraged funds into 2 separate groups: 5 High-Leveraged and 5 Low-Leveraged . Chart 2 contains the results of subtracting the averages of the 5 Low-Leveraged group from the 5 High-Leveraged group. Specifics for each fund and the averages for each group can be found in charts towards the end of the report Subtracting 5 Low-Leveraged from 5 High-Leveraged : Subtracting the averages of the 5 Low-Leveraged group from the 5 High-Leveraged group results in a distribution yield of 2.3% (High: 6.4% – Low: 4.1%) and a leverage of 41.4% (structural leverage: 35.0% and effective leverage: 6.4%). A few other metrics of note are Basic Expense, Interest Expense, and Annual Expense Ratio which come in at 0.91%, 0.12% and 1.03%, respectively. It seems 5 High-Leveraged funds have a portfolios coupon advantage. The coupon between 5 High-Leveraged versus 5 Low-Leveraged is 2.2% (High: 5.2% – Low: 3.0%). This is most likely a result of the 5 High-Leveraged group placing 13.6% of their portfolios in “unrated” municipal bonds while the 5 Low-Leverage group placing only 3.5% (a subtraction of 10.0%). UNII : The Undistributed Net Investment Income (UNII) of the High-Leveraged group is $0.0964 minus the UNII of the Low-Leverage group of $-0.006 results in a UNII of $0.1024 per share. So, the High-Leveraged MuniBndFnds have much more UNII than the Low-Leveraged funds. Dividend Cuts : Of the 5 High-Leveraged funds, only 1 cut their distribution in 2014: PIMCO CA Municipal Income II (NYSE: PCK ) . The 2014 monthly dividend rate dropped from $.0625 to $0.538, a 13.9% decline, in May. However on the Low-Leveraged side, 4 of the 5 funds cut distributions in 2014. The only fund that didn’t was Nuveen CA Muni Value (NYSE: NCA ). Nuveen Select Tax-Fee Income (NYSE: NXP ) cut it monthly distribution in 2014 once by 7.6%. Three (3) funds cut their distributions 2 times in 2014. This was Nuveen Select Tax-Free Income 2 (NYSE: NXQ ) by 12.4%, Nuveen Municipal Value (NYSE: NUV ) by 6.8% and Nuveen Select Tax-Free Income 3 (NYSE: NXR ) by 6.7%. Auction-Rate Preferred Shares : Each of the 5 High-Leverage funds uses Auction-Rate Preferred Shares (“ARPS”) for their structural leverage. Since mid-February 2008, holders of auction-rate preferred shares (“ARPS”) issued by the CEF’s have been directly impacted by a lack of liquidity. These funds have consistently “failed” because of insufficient demand to meet the supply of such securities. However, as their “failure” to issues such securities, the penalty rates for the securities is a average “maximum rate” equal to the higher of the 30-day “AA” Composite Commercial Paper Rate multiplied by a minimum of 110% or the Taxable Equivalent of the Short-Term Municipal Obligations Rate-defined as 90% of the quotient of (A) the per annum rate expressed on an interest equivalent basis equal to the S&P Municipal Bond 7-day High Grade Rate Index divided by (B) 1.00 minus the Marginal Tax Rate (expressed as a decimal) multiplied by a minimum of 110% (which is a function of short-term interest rates). However, the interest rates on “ARPS” have been below 0.25% points for the hundreds of millions of dollars to “ARPS” debt. This debt is highly accretive to leveraged funds. As with PIMCO NY Municipal Income II (NYSE: PNI ), the average EPS as it related to the dividend is -11.6%. This may be out of line for the High-Leveraged CEF’s. PNI premium is 6.9%. (click to enlarge) Low-Leverage Funds : Nuveen manages each of the 5-Low-Leveraged funds, which have an average coupon rate much lower than that of the 5 High Leverage d funds. This may be due to the level of unrated municipal bonds between the two groups. 3 of the 5 High-Leveraged funds are state municipal funds whereas the Low-Leverage funds only have 1. However, the two High-Leveraged funds that are national have an average 5.1% coupon while the 4 national Low-Leveraged funds have an average 2.8%coupon. It’s seems to me that Nuveen, which has a slew of municipal bonds, may not be paying attention to their holdings. (click to enlarge) Hedge Funds : If interest rates go up at the end of the year, both High and Low Leveraged Closed-End Funds will likely go down so. If you don’t have a “hedge” against MuniBndFnd your stock losses may mount up. We have Muni tax-free ETF known as iShares National AMT-Free Muni Bond (NYSEARCA: MUB ). MUB has a $4.12 billion net assets value (NAV), a 2.7% tax-free yield and a 0.25% expense ratio. Additionally, we have taken a counter indicator to the MUB call ProShares Short 20+ Year Treasury (NYSEARCA: TBF ) . This may cancel out each other when the stock price moves. TBF has a Net Asset Value of 1.06 billion with a 0.92% expense ratio with no dividends. Joe Eqcome, GrowthIncome Research & Management, LLC

Go Long SPY Now – Market Turn At Hand

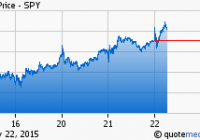
The market has accounted for its fear of the ECB and Greece year-to-date, and I believe stocks have mostly sold off in 2015 because of rumors around these events. But as rumor fades into news, stocks are poised to enjoy a relief rally, and SPY is already off its lows marked on January 15. While the Greek election results are likely to revive some fear next week, I am already taking long stakes in stocks and view SPY okay to buy in increments. It’s time to start going long the SPDR S&P 500 Trust ETF (NYSE: SPY ), aka the U.S. market, as I see a turn sometime between last week’s low and the end of the month. If I am correct that the European Central Bank (ECB) action and the Greek election and its potential repercussions have greatly swayed currencies, commodities and stocks year-to-date, then a turn may be in store in the very near-term. My reasoning is based on my belief that stocks have mostly priced in worst case scenario fueled fear, and that reality will be much less scary than expectations. Stocks seem to have already found stability, with a recent bottom marked on January 15 for SPY; and many names are rising into their earnings events now, some of which I have taken long stakes in over the past week. I’ll talk about those in dedicated articles. The market has priced in a ton of fear year-to-date, I believe around the Greek election and its potential election to drop out of (or be dropped out of) the euro-zone thereafter if the big demands of its expected new leadership are not met. But, I expect the end result of events in Greece will prove much less threatening than the market has priced in, offering opportunity for relief rally as events unfold this weekend and next month. Thus, we appear to have set up for a sell the rumor, buy the news turn of events, and it’s about time to start buying in increments here. Volatility has dropped off significantly over the last two trading days, and I’m pulling my hair out for not taking that short position in the iPath S&P 500 VIX Short Term Futures ETN (NYSE: VXX ) I had been contemplating through put options. We may get another spike in the VXX Monday after the Greek election results come in, so there could be another opportunity yet. But as for the market generally, I think it’s okay to start taking stakes in stocks again and the SPDR S&P 500 is a great way to do that. I surveyed some of my Greek contacts and have contemplated the situation; there seems to be the possibility that risk may have been overly priced into stocks around the Greek election due on Sunday. The new disruptive political party Wall Street and Brussels are concerned about, Syriza, is not the threat to European and global stability our press indicates it is. Yes, Syriza will push for renegotiation of the terms of the money Greece owes its European partners and other parties, but it will not default on that debt in my view. In other words, a Grexit is not going to happen as far as I see it. SPY’s page at Seeking Alpha shows it is only down 1.2% year-to-date after gaining back roughly 2.9% since the January 15 close. Many pundits I’ve seen talk about the market seem to conclude the valuation of the S&P 500 Index is not so cheap, with an index P/E multiple of roughly 18.8X, versus historical mean closer to 15.5X. However, the index multiple on forward estimates is 16.65X according to the WSJ page linked to above. Let’s not forget that our economy is growing at an accelerating pace and that the unemployment rate has been decreasing at a better than expected rate. Europe has its stimulus now, but the region’s decline and even China’s slowing growth are not a huge a threat to our economy anyway; that is especially true now that gasoline prices have come down so much (I’m looking for oil prices to stabilize and rise soon). My friends, I say face fear and start buying stocks now in increments and more so as we get passed this Greek election event. It will drive fear again into stocks next week, but I expect that would only open further opportunity for U.S. investors to buy SPY and stocks generally for benefit later this year. This thing has been overblown. My mouth is watering over some of the valuations I see considering this economy’s strength, so I’m gritting my teeth and buying stocks.

A New Biotech ETF Looks To Bring The Genomic Revolution To Investors

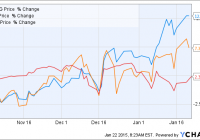
Summary The ARK Genomic Revolution Multi-Sector ETF launched last year with the goal of investing in companies that develop technologies related to extending and enhancing the quality of human life. The fund typically invests in about 40-50 names and is currently divided almost equally among all market capitalizations. The fund’s 0.95% expense ratio is currently the highest of the biotechnology ETFs. With biotechnology continuing to be the hot sector heading into 2015, we’ve seen several investment firms looking to capitalize on the trend. I’ve profiled a pair of those new biotech ETFs launched just recently here and here and another new one targeting a specific niche of the biotech universe began trading at the end of October of last year. The ARK Genomic Revolution Multi-Sector ETF (NYSEARCA: ARKG ) is from ARK Capital Management. Its primary investment objective according to the fund’s fact sheet is to identify securities that “are substantially focused on and are expected to substantially benefit from extending and enhancing the quality of human and other life by incorporating technological and scientific developments, improvements and advancements in genomics into their business. One such way this is accomplished is by offering new products or services that rely on genomic sequencing, analysis, synthesis or instrumentation.” This ETF typically invests in about 40-50 companies and isn’t necessarily looking for the next big diamond in the rough. According to the ARK Management website (which happens to update the holdings of this fund on a daily basis), the median market cap of one of its holdings is $5B. Illumina (NASDAQ: ILMN ) – the company that develops and manufactures tools for the analysis of gene sequencing – is the ETF’s current top holding but other big positions include popular names like Monsanto (NYSE: MON ), Biogen (NASDAQ: BIIB ) and even Qualcomm (NASDAQ: QCOM ). The fund doesn’t necessarily come cheap though. Its 1.45% expense ratio is currently the highest in the biotechnology ETF space easily outpacing the category average of 0.48% and the SPDR S&P 500 ETF (NYSEARCA: SPY ) ratio of just 0.09%. Management is currently capping the expense rate at its current management fee of 0.95% (administrative expenses of 0.50% are currently being waived although it’s still the highest in the sector). That’s not entirely unexpected as new funds establishing their portfolios for the first time tend to be more inefficient until the level of assets under management (currently at around $5M for this ETF currently) increases. Thanks to the continued popularity of biotechs the fund has gotten off to a fast start. Since its inception, the fund is up 13%. That’s well ahead of the iShares NASDAQ Biotechnology ETF (NASDAQ: IBB ) return of 7% and the S&P 500 return of 2%. ARKG data by YCharts Conclusion With biotechs in favor right now it’s not surprising to see niche ETFs like this popping up. The top holdings of this fund are actually fairly different from those of the Biotech Index ETF so it looks like there is some diversification potential here. The fund is off to a good start and the active management of the portfolio is a differentiator but it comes at a cost. The current expense ratio is a bit prohibitive and should be monitored to see if it comes in line with the sector average over time. Overall, investors looking for biotech exposure should consider this ETF for their portfolios. Now that you’ve read this, are you Bullish or Bearish on ? Bullish Bearish Sentiment on ( ) Thanks for sharing your thoughts. Why are you ? Submit & View Results Skip to results » Share this article with a colleague