Tag Archives: fn-start

How To Design A Market Neutral Portfolio – Part 3

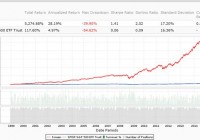
Summary How to build a robust long side. Which ETF on the short side. How to make it IRA-compliant. The first article of the series described the investor profile to hold a market neutral portfolio, some characteristics of this investing style. The second one explained the benefit of sector diversification, with examples. This one simulates solutions for the hedging position with various ETFs: leveraged and non leveraged, inverse and regular. People implementing an equity market neutral strategy usually have two balanced sets of individual stocks on both sides (long and short). Before going to the point, I want to come back on the reason why I prefer a single index ETF position on the short side. My opinion is that ‘Market Neutral’ is for risk-averse investors. Therefore it is also better to avoid a potentially unlimited risk that is not related to the market: being trapped in a short squeeze. People who think that this risk is limited to penny stocks and small caps have a short memory, or don’t know some cases. My preferred example is the ‘mother of all short squeezes’ that happened in 2008 when Volkswagen AG became briefly the highest capitalization in the world after its share price was multiplied by five in 2 days. Then it fell back to its initial level even more quickly. In the interval, investors and traders on the short side covered their positions at any price with huge losses, in panic or forced by their brokers. Whatever the reason (in this case a corner engineered by a major shareholder), and the consequences (at least a suicide has been attributed to that), I prefer avoiding by design this kind of event. Even absorbed in a diversified portfolio, such a shock hurts and may trigger a margin call for leveraged investors. On the long side… The quantitative models used for the long side of my real market neutral portfolio will not be disclosed here. However, I want to share some of its characteristics that may be reused by readers in another context. The portfolio is based on 5 different models: 2 with defensive stocks, 2 with cyclical stocks, 1 based on growth and valuation with no sector limitation. All models are based on rankings using fundamental factors. 24 stocks are selected: 14 in the S&P 500 index, 5 in the Russell 1000 index, 5 in the Russell 3000 index. The number of stocks has been chosen to limit the idiosyncratic risk. The sector diversification pattern should help beat the hedge in most phases of the market cycle. The diversification in rankings across models should limit the risk of over-optimization. The focus on large capitalizations is a choice of comfort (for myself) and ethic (for subscribers). Russell 3000 stocks are filtered on their average dollar daily volume. The portfolio is rebalanced weekly, but backtests show that a bi-weekly rebalancing doesn’t hurt the long-term performance. However, the hedge should always be rebalanced weekly. The next chart shows the simulation of this 24-stock portfolio (long side only) since 1999, with a 0.3% transaction cost and a 2-week rebalancing: (click to enlarge) Past performance, real or simulated, is never a guarantee of future returns. However, for a diversified portfolio like this one, it gives some clues about the robustness. Especially when robustness has been integrated from the design process, not just as the result of backtest optimization. On the short side… Some readers will be scared if I tell them abruptly that I use a leveraged 3x inverse ETF. Most people who are afraid of leveraged ETFs don’t really understand where their ‘decay’ comes from. If you exclude the management fee (under 1% a year), the decay has two names: roll-over cost and beta-slippage. The holdings of leveraged S&P 500 ETFs (inverse and regular) are swaps for the biggest part, and futures in second position. Rollover costs are close to zero for such contracts on the S&P 500. For beta slippage, some of my old articles have already explained what it is , and why I don’t fear it on S&P 500 leveraged ETFs. In short: most leveraged ETFs are harmful as long term holdings, but not all of them. The next table is a summary of backtests for the portfolio with different hedges, period 1/1/1999 to 11/29/2014 (weekly rebalancing). The ETF used are the ProShares Short S&P 500 ETF ( SH), the ProShares UltraShort S&P 500 ETF ( SDS), the ProShares UltraPro Short S&P 500 ETF ( SPXU) and the ProShares UltraPro S&P 500 ETF ( UPRO). For most cases it shows the performance without leverage, and with a leverage factor corresponding to holding the stocks on capital and the hedge on margin. Price data are synthetic before the inception dates (calculated by data provider). Hedge Leverage An.Ret. (%) DD (%) DL (weeks) K (%) No no 28 36 103 24 SH no 10 10 54 25 SH 2 23 23 54 25 SDS no 14 12 54 28 SDS 1.5 21 17 54 28 SPXU no 15 9 54 30 SPXU 1.33 21 11 54 30 UPRO (short) no 16 8 51 33 UPRO (short) 1.33 22 10 51 33 SPXU 50% no 20 17 51 34 SPXU 50% 1.167 24 19 51 34 SPXU 75% no 17 11 49 33 SPXU 75% 1.25 23 14 50 33 SPXU Timed no 25 15 50 34 SPXU HalfTimed no 20 10 48 36 SPXU HalfTimed 1.33 28 13 49 36 An.Ret.: annualized return DD: max drawdown depth on rebalancing (it may be deeper intra-week) DL: max drawdown length K: Kelly criterion of the weekly game, an indicator of probabilistic robustness The ‘Timed’ version uses a signal based on the 3-month momentum of the aggregate S&P 500 EPS and the U.S. unemployment rate. ‘Half Timed’ means that 50% of the hedging position is permanent, the other 50% is timed. Among the 100% market neutral versions, shorting UPRO looks better at first sight… but it is not after taking into account the borrowing rate (4.48% last time I had a look at UPRO properties in InteractiveBrokers platform). As it represents 25% of the total portfolio, the drag on the portfolio annual return is about 1%, which gives the same performance as with SPXU. I prefer buying SPXU and eliminating the inherent risk of short selling. Moreover, U.S. tax-payers can implement this kind of strategy in an IRA account if they use SPXU. Such a portfolio can be traded without leverage, but cash and IRA accounts usually have a 3-day settlement period. It is recommended trading at a broker offering a limited margin IRA feature waiving the settlement period and the risk of free-riding. It seems that Interactive Brokers and TD Ameritrade do that (and maybe others). Inform yourself carefully. Data and charts: Portfolio123 Additional disclosure: Long SPXU as a hedge.
Dogs Of The Dow Part II And The Return Of The Goldbugs?

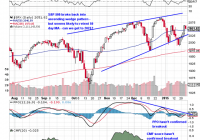
Summary SunAmerica Focused Dividend has turned it around in 2015, are the Dogs of the Dow back? Can active managers catch up after a disastrous 2014? Can the Goldbugs find a way to shine in 2015? It has only been three weeks since our posting on SunAmerica Focused Dividend (MUTF: FDSAX ) and while the ‘Dogs of the Dow’ may have continued to slumber since then, something is definitely working for the fund. In the 7th percentile on a YTD basis, the fund has delivered a solid 2.79% return since our posting compared to 1.55% for the S&P 500 and .82% for the Russell 1000 Value iShares. While we always like to see ourselves proven right (who doesn’t?), the reasons why FDSAX has outperformed so far in 2015 could spell more trouble for active management in the year to come. The secret to FDSAX’s strong performance in 2015 really isn’t that hard to figure out; just head over to Morningstar.com and check it out. What’s in the secret sauce? Well it’s not the Dogs of the Dow although only 4 of the Dogs it holds are underperforming the Dow Jones Industrial Average so far this year. The secret to their success; video games and cigarettes or put another way a deeply discounted retailer (Gamestop (NYSE: GME )) and the 4 largest remaining cigarettes manufactures in the world, the foundations of the consumer staples category. What’s made FDSAX so successful is that incredible difference in performance between the different sectors of the market with a spread of nearly 800 bps between utilities (the Utilities Select Sector SPDR ETF ( XLU) – up 4.07%) and financials (the Financial Select Sector SPDR ETF ( XLF) – down 3.88%) in 2015. For the same period of 16 trade days at the start of 2014, the spread between healthcare and consumer cyclicals was only 594 bps. If the trend continues, 2015 is shaping up to be another year that separates the true active managers from the closer indexers. Let’s start by taking a look at the broader market to see what we can make of the situation. Starting with a daily chart, the S&P 500 was pulled back into the late 2014 ascending wedge on the promise of the new ECB QE program along with a spate of negative economic reports here at home that lite the hope that the Fed’s anticipated rate hike program is on hold. (click to enlarge) While Thursday’s price action was a welcome change, all things considered the weekly action was unimpressive. The volume heading into Thursday was steadily diminishing and Friday’s close just off the lows failed to confirm the move higher. Today’s election of a new leftist government in Greece probably won’t help the open on Monday. As of press time (10:30), the VIX futures had jumped although we backing off the highs. On a weekly basis, you can see the S&P bounced off the first potential stopping out point, but we’ll need to see follow through this week to confirm whether this is just a bounce off one day’s positive news. The fact that the news that lifted the market originated overseas rather than here doesn’t strike me as particularly positive. (click to enlarge) What’s more worrying for trying to separate the closet cases from the true active managers is that the internal make-up of the market doesn’t show any signs of improving although the recent trend towards defensive sectors might be running out of steam. First let’s start with this chart showing the percentage of stocks above their 200 day moving average. You can see that the percentage is way off, even after Thursday’s big one day spike but you have to consider what did well versus what lagged last week. (click to enlarge) Sector wise, Healthcare and Financials make up nearly 30% of the S&P 500 and both lagged noticeably; the financials have been hit hard on weak earnings and healthcare stocks are showing signs that they’re running on fumes after so many years of strong performance. That strong performance is probably the biggest detractor to stronger returns going forward as long term investors have serious gains to protect. Consumer defensive’s and healthcare stocks also underperformed for the week although they make up a much smaller portion of the index at a little more than 12% while high flying REIT’s make up only around 2%. (click to enlarge) (click to enlarge) (click to enlarge) (click to enlarge) For the S&P 500 to really breadth stabilize and give the market a fighting chance to making serious gains, the last need to become the first. Consumer cyclicals and industrials make up over 22% of the S&P 500 and have had…well mixed performance following tough 2014’s. And the best that can be said about energy stocks is that they haven’t gotten lot worse. This is why market prognosticators always say defensive-led rallies are doomed to failure in the long run. They make up such a relatively small part of the market that as long as they’re pulling the market higher, the advance will be tepid and unstable. Goldbugs Take Heart: What about the Yinzer Analyst’s favorite wager of 2015, European equities? Well you can see that the unhedged iShares MSCI EMU ETF ( EZU) managed a decent advance for the week although it underperformed SPY, up 1.36% to 1.66%. On a daily chart basis, the advance off a retesting of the downtrend line was confirmed by a shift in momentum and the sharp rise in the CMF (20) score although the failure to break above the 50 day moving average was disheartening. (click to enlarge) On a weekly basis, the sharp uptick in volume was offset by a middling CMF score for the week leading to a decline in the CMF 20 and failing to confirm the breakout. With Sunday’s election in Greece, the most likely direction will be lower to retest the downtrend line. (click to enlarge) Who has enjoyed a seriously strong and undeniably positive start to 2015 are the gold miners. After so many bad years, could the global uncertainty over deflation and equity weakness here at home be ready to push the miners back towards their 2014 highs? Take a look at the daily chart below, you can see the Market Vectors Gold Miners ETF ( GDX) managed to push back into its 2014 trading range before getting stuck at the 200 day moving average, but the real handicap for the week wasn’t profit taking (we hope) or covering old losses, but a positive week for the S&P 500. Despite the best efforts of the Permanent Portfolio Fund (MUTF: PRPFX ) which is killing it in 2015, gold has lost its luster for most investors and the miners especially aren’t playing a big role in their portfolios anytime soon. But hey, room to grow right? (click to enlarge) Longer term, the miners are still stuck in the falling wedge pattern that has been guiding its destiny ever downwards since 2012. This week GDX ran smack into the upper boundary and managed to push through it before running out of steam and closing below the trend line. For those gold bugs out there, take heart. Volume was lower on the week and didn’t damage the uptrend line while the MACD seems to be in the early stages of rolling over to turn positive. Even if the move turns out to be another false rally, take heart goldbugs, the pattern continues to narrow indicating a breakout could be in the cards later in 2015. (click to enlarge) That’s it for the Yinzer Analyst tonight; he’s going to need his rack time before getting up to clear some snow. But tomorrow is a new day and another change to make some money, make sure you’re ready for whichever way the market bends.

GLD And Its Relation To The Greek Elections, ECB’s QE And FOMC Meeting

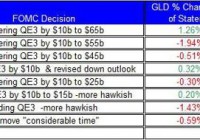
The rise in uncertainty in Europe over the recent Greek elections results in ECB’s QE program play in favor of GLD. Will the upcoming FOMC meeting and GDP update for the fourth quarter impact the direction of GLD? The market has revised down the probabilities of a rate hike in the coming FOMC meetings. The results of the latest elections in Greece along with ECB’s decision to start its quantitative easing program have provided back-wind for the SPDR Gold Trust ETF (NYSEARCA: GLD ). Let’s examine the recent developments in Europe and the upcoming reports in the U.S. including FOMC statement and GDP update. The latest news about election results in Greece, in which the extreme left party Syriza won, is likely to bring this country one step closer towards leaving the European Union, could stir up the markets, raise the uncertainty levels and depreciate the Euro against leading currencies. But it’s not likely to have substantial long-term adverse ramifications on the EU, as suggested in this analysis . This news along with ECB’s decision to implement a $1.3 trillion QE program could still drive higher the demand for precious metals investments including GLD, which tend to strive when central banks devalue their currency and the uncertainty level in the markets rise. Nonetheless, bear in mind that the ongoing rally of the U.S. Dollar against the Euro and other currencies will eventually curb down the rise in the price of GLD. This week the FOMC will convene for the first time this year. In the previous meeting back in December, the FOMC concluded its meeting with the decision to repurpose the term “considerable time” with respect to the timing of the rate hike; the FOMC kept the term as a reference point to its current policy – the normalization process will continue to be data dependent and a rate hike won’t happen anytime soon with the key word being patience: “… the Committee judges that it can be patient in beginning to normalize the stance of monetary policy.” Moreover, in the press conference that followed, FOMC Chair Yellen also pointed out that the FOMC is likely to raise rates in the next couple of meetings. (click to enlarge) Source of data: FOMC’s site and Bloomberg This time, the FOMC meeting will include a press conference or an update for the economic progress of the U.S. But the last updates by the IMF and World Bank showed that the U.S. economy is likely to grow in 2015 by 3.6% and 3.2%, respectively. In both cases, these organizations revised up their assessments from their previous estimates, in part, due to low oil prices. The current low oil prices are also likely to bring down GLD – after all potential rise in inflation is among the main reasons for people to invest in gold assets such as GLD. Well, this doesn’t seem to be the case. Despite the expected higher growth in GDP, the markets have started to revise their expectations about the next rate hike of the FOMC. According to the CME , the probability of a rate hike in the June meeting is currently only 12% – a month ago this probability was around 30%. Further, the implied probability of a rate hike in the July meeting has been updated from 57% a month ago to 28%. So the markets have updated their projections based on the current low inflation. The low inflation could eventually result in the FOMC pushing forward the first and subsequent rate hikes. Such a scenario is likely to keep pushing up the price of GLD: After all, low cash rate tends to translate to low long-term treasury yields. If U.S. treasury yields remain low, this could contribute to the short-term recovery of GLD. But the upcoming FOMC meeting isn’t likely to stir up the markets considering Yellen’s promise not to rock the boat in the next two meetings. Therefore, the market reaction is likely to moderate and GLD isn’t expected to do much – we could see a similar reaction as we did in the last meeting. Another report to consider is the upcoming GDP report – first estimate for the last quarter of the year. The current estimates are for the GDP report to show a gain of 3.1%. In the past, these reports didn’t seem to have much of a strong impact on the prices of GLD, as you can see in the table below. Source of data taken from Bloomberg and BEA Nonetheless, this report is still likely to influence FOMC members with respect to their rate decision. If the U.S. economy keeps showing a steady growth, this is likely to bring the FOMC closer to pushing the trigger on the rate hike. Despite the latest developments in Europe, the direction of GLD is mostly related to the changes in U.S. including the FOMC’s policy and the progress of the U.S. economy. If the FOMC were to push forward its first rate hike, this could keep up the price of GLD. For more see: What are the advantages of GLD?