Tag Archives: fn-start

The ‘Efficiency’ Of The Market Doesn’t Matter To Smart Investors

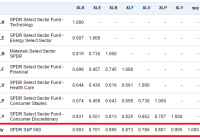
The huge growth in index funds has caused some investors to debate the merits of the market’s “efficiency” and whether index funds would make the markets less efficient. The basic thinking is that if everyone starts buying index funds then that could create more opportunities for stock pickers who are able to go against the grain and pick the stocks that have been unjustifiably correlated to the actions of the overall index. This whole debate confuses why correlations are rising in the first place. Correlations aren’t rising because index funds are becoming more prevalent. Index funds are becoming more prevalent because the performance of the economy is becoming increasingly correlated. If you look at any sector of the S&P 500, you’ll find rising correlations over the course of the last 50 years. The average 10-year correlation of all the sectors of the S&P 500 is about 83.5%: (10-Year Correlation of various sectors) This isn’t happening because index funds are becoming more popular. It’s happening because US corporations are becoming increasingly interconnected. Public companies are becoming multi-national and multi-industry companies whose performance depends increasingly on the way the macroeconomy works. If we look at the underlying Earnings Per Share of these same industries, we find equally strong correlations in their profit growth over time. Of course, high correlations doesn’t mean there won’t be uncorrelated entities whose prices get irrationally whipsawed by the aggregate market performance. But it does mean that it is becoming increasingly difficult to find entities who aren’t dependent on the performance of the broader economy. Finding truly uncorrelated companies is not as easy today as it might have been back in the early 1900s when the broader economy was much more fragmented. Paul Samuelson always argued that the markets were micro efficient, but not macro efficient. Indeed, the whole concept of market “efficiency” is becoming increasingly irrelevant in a world where entire economies are becoming so highly correlated. But this doesn’t change the importance of understanding the discussion and its impact. At the aggregate level, we have all become “asset pickers.” The distinction between “active” and “passive” investors is largely irrelevant in a world where we all now pick baskets of assets inside the global aggregate. And when one deviates from global cap weighting (roughly the Global Financial Asset Portfolio) you are engaging in a form of asset picking that makes you no different than a stock picker. You are declaring that you can generate a better risk adjusted return than the global aggregate. Indexing has become the new stock picking. Instead of picking 25 stocks in an index, we now pick baskets of index funds inside a global aggregate. The idea of “market efficiency” was never very useful to begin with however because it is constructed around a gigantic political strawman. The EMH is essentially a political construct that argues that discretionary intervention is useless because “the market” is smarter than everyone else. It is a political argument against discretionary intervention that was constructed to create a theory of finance that was consistent with an anti government economic theory (Monetarism primarily). In essence, you can’t “beat the market” because the market is so smart. This is silly though. The market will generate the aggregate market return and your real, real return will be the market return minus the rate of inflation, taxes and fees. Taxes and fees alone will reduce the aggregate return by over 35% (if we assume a 10% aggregate return, 1% fees and 25% tax rate). No one will consistently beat “the market” aside from a few lucky outliers. The math just doesn’t work. And the index we are comparing ourselves to is a completely fictitious benchmark because the average real, real return is lower than the pre-tax and pre-fee benchmark to begin with. But the EMH defenders have misconstrued this entire debate to promote a political position constructed by anti government economists at the Chicago School of Economics. Imagine, for instance, that, for the purpose of record keeping, at the end of each NBA basketball game, the NBA reduced the average score of 100 points by 25%, and then imagine that the coaches reduced the score by another 10%. What the EMH defenders have done is argued that the score of 100 means that the teams are all terrible because they cannot, on average beat this “benchmark.” There will be outlier teams who sometimes score more than 100 points, but on average these “professional” teams will underperform. EMH defenders have used this strawman to argue that “active” investors are all terrible. It’s a completely useless construct that does nothing more than misconstrue the entire premise of the discussion. Of course, none of this means that high fees and overly active trading are good. After all, when one engages in such activities they only increase the size of the friction, which reduces returns in the first place. But the debate about EMH and “active” vs. “passive” has been blurred by a useless discussion about how “efficient” the market is. The reality is that we are all active investors to some degree. All indexers have to pick their asset allocations and the funds they will use. All indexers time their entry/exit points, their rebalancing points, their “tilts,” etc. The smarter indexer tries to capture much of the broad market gain while reducing their tax and fee burden. But that has nothing to do with whether the market has become “efficient” or whether some degree of “active” management is “smart” or “stupid.” Samuelson was right – the market is micro efficient and macro inefficient. And as the market has become increasingly macro oriented the discussion about the “efficiency” of the market has become increasingly useless.
For Passive Funds, A Stronger Link Between Fees And Performance

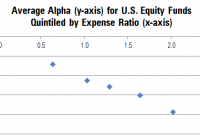
By Michael Rawson When shopping for products of unknown quality, price forms a cue that shoppers can use to differentiate products. It is often a safe assumption that a higher priced product offers better performance than a lower priced product. For instance, the Porsche 911 lists for $93,000 while the Chevy Malibu will set you back $20,000. But this is not always the case, particularly with fund investing. Unlike the Porsche, there is no cachet from buying a high-priced fund. Still, price can be useful when predicting results – though not in the way fund companies would like. Morningstar’s Analyst Rating for funds is based on five pillars: People, Parent, Process, Performance, and Price. The first three of these pillars are somewhat qualitative, while Performance and Price are much more quantitative. Price is the most tangible, both in terms of the impact of price on fund performance and comparability across funds. On average, we find that the higher the price of a fund, the worse its performance tends to be, and the link between fees and performance is stronger for passive funds. The chart below illustrates the relationship between price and performance among U.S. equity funds. It shows the average alpha (excess returns after adjusting for risk relative to the category benchmark) for all funds grouped into five quintiles by expense ratio. The y-axis shows the average alpha and the position on the x-axis indicates the average expense ratio for the group. We included all U.S. equity funds that existed five years ago and survived through today. Because some funds have performance-based fees, we used the 2009 annual report expense ratio rather than the expense ratio during the sample period. This also simulates the results of picking funds based on currently available information and examining future performance. As the chart illustrates, there appears to be an inverse relationship between fees and performance. The lowest-fee quintile has an average expense ratio of 0.64% and an average alpha of negative 0.71%, while the highest-fee quintile has an average expense ratio of 2.02% and an average excess return of negative 1.94%. However, grouping the funds into quintiles masks the tremendous variability in the relationship between fees and performance, which is better illustrated in the following graph. Here, the relationship appears much less precise. In fact, a regression of alpha on expense ratio has an R-squared of just 6%, suggesting that fees explain a small portion of the overall variability in fund performance. However, there are a few issues that may obfuscate this relationship. The chart above includes all U.S. equity funds, even though small-cap funds have higher expense ratios than large-cap funds. It also includes all available share classes despite the fact that low-cost institutional share classes must outperform high-cost retail share classes of the same fund. Also, the relationship between fees and performance might be different for active and passive funds. Because passive funds seek to match an index less fees, the relationship between fees and performance might be stronger among them. In contrast to passive funds, well-run active funds have a better chance of earning back their fees. In order to address these issues, we narrowed our focus to large-cap U.S. equity funds and removed multiple share classes of the same fund to get a cleaner read on the link between fees and strategy performance. We also grouped active and traditional broad passive funds separately and removed most niche index and strategic beta funds (index funds that make active bets in an attempt to outperform traditional indexes). The results are shown in the following chart. In this chart, the relationship between fees and performance is a bit clearer. For active funds, there is still a tremendous amount of variability, but there appear to be more dots in negative territory as we move from lower- to higher-cost funds (from left to right on the chart). Passive funds seem to hew closer to a straight line. Quantifying this relationship with a regression that expresses the expected alpha as a function of the expense ratio highlights the negative slope. For active large-cap funds, the expected alpha is approximately negative 1.21 times the expense ratio. In other words, a fund with an expense ratio 10 basis points above the average would be expected to deliver an alpha 12 basis points lower than average. While the relationship is significant, the R-squared is only 6%. Despite the poor fit of the model linking fees to performance for active large-cap funds, lower-fee funds still had a better chance of outperforming on average. This simply indicates that, while fees are predictive of performance, there are many other factors that matter. For passive large-cap funds, the R-squared is 38%. This means that there is a cleaner relationship between fees and performance for passive funds than active funds. In the sample studied, active funds in the lowest expense ratio quintile had a 28% chance of earning a positive alpha compared with just a 15% chance for those in the highest-cost quintile. But the relationship is even stronger for passive funds. About 52% of passive large-cap funds in the lowest-cost quintile earned a positive alpha (however small), while none of the funds in the highest-cost quintile did. This suggests that investors can increase their probability of success by selecting low-cost funds. Fortunately, there are a lot of low-cost passive and active funds to choose from. Vanguard Total Stock Market ETF (NYSEARCA: VTI ) holds more than 3,000 U.S. stocks and offers similar exposure to iShares Russell 3000 (NYSEARCA: IWV ) . The funds have had similar returns and risks over the past decade. However, the Vanguard fund charges 0.05% compared with 0.20% for the iShares fund. Assuming both funds return 5% annually gross of fees over 10 years, a $100,000 investment in VTI would be worth about $2,300 more at the end of the period than an investment in IWV. Among active funds, Price is one of five pillars taken into consideration in the Morningstar Analyst Rating for funds. When there are multiple funds that offer similar exposure, the lowest-cost option may be the prudent choice. Disclosure: Morningstar, Inc. licenses its indexes to institutions for a variety of reasons, including the creation of investment products and the benchmarking of existing products. When licensing indexes for the creation or benchmarking of investment products, Morningstar receives fees that are mainly based on fund assets under management. As of Sept. 30, 2012, AlphaPro Management, BlackRock Asset Management, First Asset, First Trust, Invesco, Merrill Lynch, Northern Trust, Nuveen, and Van Eck license one or more Morningstar indexes for this purpose. These investment products are not sponsored, issued, marketed, or sold by Morningstar. Morningstar does not make any representation regarding the advisability of investing in any investment product based on or benchmarked against a Morningstar index.

The Best Gold Fund To Own

Summary Gold miners have unique situations due to differing geographic, regulatory and currency risk, as well as different ore quality. Gold mining index ETFs are good for trading and short-term exposure. Long-term investors who plan on holding longer than three months should consider TGLDX instead. Investors have flocked to index funds and ETFs due to their low cost, tax efficiency and transparency. The general rise of indexing has helped ETFs grow rapidly, taking market share from mutual funds, particularly actively managed funds. However, there are clear-cut cases of active managers outperforming their indexed competition. One example is the gold mining sector. Gold Funds Since the inception of the Market Vectors Gold Miners ETF (NYSEARCA: GDX ) in 2006, the fund has seen an incredible inflow of funds, to $7.1 billion as of January 23. The small cap edition, Market Vectors Junior Gold Miners ETF (NYSEARCA: GDXJ ) has amassed $2 billion in assets since its inception in late 2009. The actively managed the Tocqueville Gold Fund No Load (MUTF: TGLDX ), which was created back in 1998, has attracted only $1.3 billion in assets. For short-term investors, the ETFs make sense due to TGLDX’s short-term trading fee of 2 percent. The high volume in GDX and GDXJ indicates traders are using the ETFs to speculate on the volatile sector, even after a long bear market in mining shares. However, long-term investors may also be holding shares. Those investors are placing their confidence in the market cap-weighted indexing strategy, but the gold mining industry is one where active management can pay off. The saying “A mine is a hole in the ground with a liar at the top” is attributed to Mark Twain, and it gets to the heart of the difficulty in evaluating mining companies. The track record of TGLDX shows that this assumption is correct. The chart below is a price ratio of TGLDX to GDX – a rising line shows outperformance by TGLDX. (click to enlarge) Since its inception in 2006, TGLDX has generally outperformed GDX. Aside from an 18-month period from summer 2007 to 2009, TGLDX hasn’t spent much time trailing GDX. The total return since May 16, 2006, the inception of GDX, shows that TGLDX has built up a considerable lead: a loss of 4.46 percent versus a decline of 38.13 percent in GDX. (click to enlarge) TGLDX does have an advantage over GDX in that manager John Hathaway can choose to hold more small cap miners than the market cap-weighted index. However, TGLDX also beat GDXJ since the inception of that ETF, a loss of 33.12 percent versus a drop of 68.07 percent for GDXJ. This indicates stock selection is playing a role in TGLDX’s outperformance. (click to enlarge) The strong performance in TGLDX has more than made up for its higher expense ratio of 1.36 percent, versus 0.53 percent for GDX and 0.58 percent for GDXJ. TGLDX Recognized by Lipper as the Best Fund in the Precious Metals category during the last five years, the Tocqueville Gold Fund is co-managed by John Hathaway and Doug Groh. Originally created in 1998 by Mr. Hathaway, the fund was initially designed to take advantage of the negative psychology that surrounded the gold market at that time. The no-load fund is based on a contrarian value investment philosophy, and seeks long-term capital appreciation. The minimum investment is $1000 ($250 IRA). In addition to the 1.36 percent expense ratio, there is a 2 percent fee on shares held less than 90 days. This is not a fund for traders, but for long-term investors who want exposure to gold mining shares. Mr. Hathaway, senior managing director at Tocqueville Asset Management, is the portfolio manager for the Tocqueville Gold Fund. In 1986, he founded Hudson Capital Advisors and managed the firm until 1997, when he joined Tocqueville. Mr. Hathaway earned his B.A. From Harvard University, M.B.A. from the University of Virginia and began his career in 1970 employed as an equity analyst with Spencer Trask & Co. As portfolio manager for the Tocqueville Gold Fund, he searches for companies in the gold sector that have excellent management teams and assets that provide the most value independent of the price of gold. Researchers for the fund follow the entire gold resource and mining industry. Investing in the gold sector from 1998 to 2011 produced record returns. Since then, the sector has been out of favor and has taken quite a hit. Spot gold traded at a high above $1,900 an ounce in 2011, and finally found a bottom below $1,200 an ounce in 2014. Mr. Hathaway believes that the slump may be close to reversing for gold investors, and holds that a bottom in gold is being formed. Mr. Hathaway believes that the price of spot gold has been discounted to a point where most of the negative headlines are priced in. At some point, rates will need to be taken higher, and this could prove to be very disruptive to the markets. Back in November, he saw gold rallying along with the U.S. dollar as a sign of alternative reserve currency risk . The recent performance of gold in euros shows he was on target with this view. (click to enlarge) Finding Winners Aside from a 12 percent position in physical gold, the $1.3 billion fund is mostly invested in equities related to precious metal mining. While this sector can be challenging, Mr. Hathaway has a knack for discovering hidden gems involved with exploration and building up production. Gold mining is a capital-intensive business that takes many years to develop and will see many different issues over those years. An obvious change is in the price of gold, but companies in the gold sector must also deal with change in governments, currency devaluations, central bank policy and both local and global economic conditions. The fund takes a diversified approach and invests in all types of business models, ranging from royalty companies to businesses involved only in exploration. Speaking about the fund’s strategy, Hathaway said: “Our strategy for the Fund has been to find companies that are adding value even in a low gold price environment. As a result, we tend to focus on smaller companies and steer clear of larger companies that have either experienced operational challenges or have lower levels of reserves in their portfolio. We believe having smaller companies in the portfolio has been an important contributor to the Fund’s outperformance relative to its benchmark and the Morningstar Equity Precious Metals Funds Category over time.” The top five holdings behind the 12 percent holding in physical gold are Royal Gold (NASDAQ: RGLD ), Franco-Nevada (NYSE: FNV ), Eldorado Gold (NYSE: EGO ), Goldcorp (NYSE: GG ) and Agnico Eagle Mines (NYSE: AEM ). Allocations in the top ten range from 6.62 percent in Royal Gold to 3.19 percent in Yamana Gold (NYSE: AUY ). Recent underperformance by Eldorado and Yamana have dinged the fund in 2015. The fund is up 11.06 percent through January 23, versus a 15.42 percent return for GDX. Royalty companies play a major role in the fund, with about 12 percent of its assets invested in two of the major players: Royal Gold and Franco-Nevada. The business model that royalty companies are based on has become attractive to gold investors. Gold royalty companies help finance mining construction and receive royalty payments in return. By investing this way, they avoid some of the hazards and costs of exploration or operations. The stream of payments that gold royalty companies receive are based on future sales, and are not as sensitive to spot gold price fluctuations. Mr. Hathaway recognized the inherent value of these type of investments early on and included them in TGLDX. Gold’s price decline in the last 3 years has been devastating for many gold mining companies. While some are specialized in exploration, others have expertise in development. Many in the niche are having to rethink their business models and capital spending plans in order to become profitable. This has led to an increase of mergers and acquisitions in the industry, and presents the fund with the ability to invest in companies that may be targeted acquisitions. In fact, the fund performed well in 2014, beating the category by more than 6 percent, by holding a large position in Osisko Mining Corp. ( OTC:OKSKF ). It became a top-weighted position in the fund until going through its merger . Another possible acquisition target that has been placed in the fund’s portfolio is based in Ontario, Canada. Detour Gold Corp. ( OTCPK:DRGDF ) is expected to become the largest operating gold mine in Canada, with a possible lifespan of 21 years. With Osisko Mining being acquired, investors began looking for the next target for a merger. Mr. Hathaway believes there will be more opportunities such as these, and continues to scour the landscape for possibilities. With around 17 years at the helm of the Tocqueville Gold Fund, Mr. Hathaway has his pulse on the gold sector and possesses a management style that’s been beneficial to its investors. TGLDX has beaten the returns of popular gold ETFs, and investors looking to establish a long-term position in the sector should look to the fund. Outlook for Gold Mining Shares In many foreign currencies, gold is experiencing a strong rally, trading at a 12-18 month high, depending on the currency. Gold is near its all-time high in yen, and at all-time highs in currencies that crumbled last year, such as the Russian ruble. If gold remains an alternative to the U.S. dollar as a reserve asset/safe haven currency, the price could remain elevated even amid a U.S. dollar bull market , since such a bull market will likely be accompanied by a series of financial or currency crises in emerging markets due to the run-up in dollar-denominated debt over the past several years. Falling energy prices, along with other costs for mines located abroad could help miners increase non-dollar profits. For example, in January alone, gold went from $1400 to $1600 in Canadian dollars. A 20 percent combination move in gold and Canadian dollar depreciation would lift the metal to a new all-time high in Canadian dollars. A pullback in gold and rebound in foreign currencies is long overdue, though, at least in the short run. Miners used the recent jump in prices to raise cash as well. The industry diluted shareholders to the tune of more than $800 million in January 2015 alone. The share issuance sent shares of the affected miners lower, and until business conditions for the sector improve markedly, further share issuance is possible. The best-case scenario for mining shares amid a U.S. dollar bull market (leaving aside a new bull market in the U.S. dollar price of gold) is if foreign demand for hard money keeps the price of gold level or even increases it slightly in U.S. dollars. The price in foreign currency could rise substantially as foreign currencies devalue versus the dollar and gold, and since mining shares are leveraged to the price of gold, their earnings could rise significantly. If, instead, the gold price falls, high-cost miners will struggle to remain profitable and the bear market for mining shares will continue.