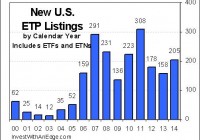
Exchange traded product launches numbered 205 (193 ETFs and 12 ETNs) in 2014, a figure more or less in the middle of the range of the past nine years. Closures came in at 79, resulting in a net increase of 126 for the year. Product count increased by 8.2% to 1,662, and assets jumped by 17.8% to end the year at $2 trillion . Actively managed listings surged 78% with 56 new funds and just 2 closures to finish the year at 125. We separate ETPs into nine major groups, and based on these divisions, international and global equity ETFs were the most prevalent type of new product in 2014. The 68 international and global equity funds accounted for nearly a third (33.2%) of the year’s 205 launches. Additionally, 10 of the bond fund launches targeted international debt securities, further solidifying 2014’s theme of investing outside of North America. Style and strategy ETFs were the second largest group of new products at 52. The prior year’s (2013) largest category, bond funds, came in third with 42 introductions. There were no new currency funds introduced, and 2014 marked the third year in a row without any new ETPs targeting volatility as an investment class. However, there were numerous products brought to market with currency hedging and low volatility factor strategies. Slicing the data differently can help identify industry trends. Last year might be called the year of actively managed ETFs with 56 launches, and there are now 125 ETFs fitting that description. The category still only accounts for 7.5% of listed products, but it grabbed a 27.3% share of new product launches. Another theme in 2014 was the use of hedging strategies by 29 of the new products. This is a carry-over and strengthening of the 2013 trend when 23 ETPs employing hedging came to market. The majority of these products hedge their currency exposure, a feature that improves performance when the underlying currencies lose strength to the U.S. dollar as they did in 2014. Master Limited Partnerships (“MLPs”) continue to see product growth with seven MLP ETPs coming to market in 2014. Only two chose to use the dreaded C-Corporation structure , as investors become more aware of the severe performance degradations resulting from double-taxation of tax-efficient MLPs. Eighteen new products use a fund-of-funds structure, where the primary holdings are other ETFs and ETNs. This is often a more efficient way to execute actively managed strategies. Smart beta, or alternative beta, was a widely discussed trend in 2014. In its simplest form, alternative beta products are defined as those using something other than a traditional capitalization weighting methodology. You might also hear them referred to as products breaking the link between security price and weighting. More than a quarter of all the product launches in 2014 easily fit this definition. We have not refined our alternative beta classification methodology yet and don’t have an exact count. ETFs based on ‘quality’ and ‘volatility’ factors were popular forms of alternative beta during the year. As usual, BlackRock was the most prolific issuer, bringing out 29 new products under the iShares brand and pushing the year-end count to 299 iShares ETFs. Other notable sponsors with double-digit launches include State Street SPDRs with 20, First Trust with 15, and newcomer WBI with 10. New products ending the year with the most assets included the First Trust Dorsey Wright Focus 5 ETF (NASDAQ: FV ) $1.3 billion, the UBS AG FI Enhanced large Cap Growth ETN (NYSEARCA: FBGX ) $660 million, the Credit Suisse FI Large Cap Growth Enhanced ETN (NYSEARCA: FLGE ) $575 million, the Vident Core U.S. Bond Strategy ETF (NASDAQ: VBND ) $370 million, and the First Trust Eurozone AlphaDEX ETF (NASDAQ: FEUZ ) $340 million. Since funds launched in January had 12 times as many months as those launched in December to attract assets, the year-end asset levels do not necessarily reflect the fastest growing products. The table below lists all 205 new products sorted by launch date, although you have the ability to sort on other columns. The IPO date is the first day the product was listed and available for purchase. The “first trade” may be a later date in some cases, as a few products did not have any first-day volume. Additionally, the “inception date” for many ETFs is often a meaningless date as it can be a day or more before the product actually becomes listed and available for purchase. # Ticker Name Category IPO Date Notes 1 FTHI First Trust High Income Style/Strat 01/07/2014 1,4,5 2 FTLB First Trust Low Beta Income ETF Style/Strat 01/07/2014 1,4,5 3 RDVY First Trust NASDAQ Rising Dividend Achievers Style/Strat 01/07/2014 5 4 IEMF EGShares TCW EM Intermediate Term IG Bond Bond 01/08/2014 5 LEMF EGShares TCW EM Long Term IG Bond Bond 01/08/2014 6 SEMF EGShares TCW EM Short Term IG Bond Bond 01/08/2014 7 SYE SPDR MFS Systematic Core Equity ETF Style/Strat 01/09/2014 1 8 SYG SPDR MFS Systematic Growth Equity ETF Style/Strat 01/09/2014 1 9 SYV SPDR MFS Systematic Value Equity ETF Style/Strat 01/09/2014 1 10 SHYD Market Vectors Short High-Yield Municipal Bond 01/14/2014 11 HOLD AdvisorShares Sage Core Reserves ETF Bond 01/15/2014 1 12 NYCC PowerShares NYSE Century Portfolio Style/Strat 01/15/2014 13 EURZ Direxion Daily FTSE Europe Bear 3x Shares Inverse 01/22/2014 14 EURL Direxion Daily FTSE Europe Bull 3x Shares Leveraged 01/22/2014 15 VUSE Vident Core U.S. Equity ETF Style/Strat 01/22/2014 16 DBAW Deutsche X-trackers MSCI AW ex US Hedged Global/Intl 01/23/2014 4 17 DBMX Deutsche X-trackers MSCI Mexico Hedged Global/Intl 01/23/2014 4 18 DBKO Deutsche X-trackers MSCI South Korea Hedged Global/Intl 01/23/2014 4 19 ZMLP Direxion Zacks MLP High Income (C-Corp) Sector 01/23/2014 3,5 20 QEM Market Vectors MSCI Emg Mkts Quality Global/Intl 01/23/2014 21 QDEM Market Vectors MSCI Emg Mkts Quality Div Global/Intl 01/23/2014 5 22 QXUS Market Vectors MSCI Intl Quality Global/Intl 01/23/2014 23 QDXU Market Vectors MSCI Intl Quality Dividend Global/Intl 01/23/2014 5 24 DI PIMCO Diversified Income Active Bond 01/23/2014 1 25 LDUR PIMCO Low Duration Active Bond 01/23/2014 1 26 HEFA iShares Currency Hedged MSCI EAFE ETF Global/Intl 02/04/2014 2,4 27 HEWG iShares Currency Hedged MSCI Germany ETF Global/Intl 02/04/2014 2,4 28 HEWJ iShares Currency Hedged MSCI Japan ETF Global/Intl 02/04/2014 2,4 29 TFLO iShares Treasury Floating Rate Bond ETF Bond 02/04/2014 30 USFR WisdomTree Bloomberg Floating Rate Trsy Bond 02/04/2014 31 IBMH iShares iBonds Sep 2019 AMT-Free Muni Bond Bond 02/06/2014 32 GGBP AdvisorShares Gartman Gold/British Pound Commodity 02/12/2014 1,4 33 GEUR AdvisorShares Gartman Gold/Euro Commodity 02/12/2014 1,4 34 GYEN AdvisorShares Gartman Gold/Yen Commodity 02/12/2014 1,4 35 GLDE AdvisorShares International Gold Commodity 02/12/2014 1,2,4 36 EQLT Workplace Equality Portfolio Style/Strat 02/25/2014 37 IEIL iShares Enhanced International Large-Cap Global/Intl 02/27/2014 1 38 IEIS iShares Enhanced International Small-Cap Global/Intl 02/27/2014 1 39 IPKW PowerShares International BuyBack Achievers Global/Intl 02/27/2014 40 SIPE SPDR Barclays 0-5 Year TIPS ETF Bond 02/27/2014 41 HKOR Horizons Korea KOSPI 200 ETF Global/Intl 03/04/2014 42 YPRO AdvisorShares YieldPro ETF Bond 03/05/2014 1 43 KBA KraneShares Bosera MSCI China A ETF Global/Intl 03/05/2014 44 FV First Trust Dorsey Wright Focus 5 ETF Style/Strat 03/06/2014 45 AIRR First Trust RBA Amer. Industrial Renaissance Sector 03/11/2014 46 QINC First Trust RBA Quality Income ETF Global/Intl 03/11/2014 5 47 GURI Global X Guru International Index ETF Global/Intl 03/11/2014 48 GURX Global X Guru Small Cap Index ETF Style/Strat 03/11/2014 49 GVAL Cambria Global Value ETF Global/Intl 03/12/2014 50 IJNK SPDR Barclays International High Yield Bond Bond 03/13/2014 51 SPLX ETRACS Mthly Reset 2xLvgd S&P 500 TR ETN Leveraged 03/26/2014 52 TOLZ ProShares DJ Brookfield Global Infrastructure Global/Intl 03/27/2014 53 EDOG ALPS Emerging Sector Dividend Dogs ETF Global/Intl 03/28/2014 5 54 DXJC WisdomTree Japan Hedged Capital Goods Sector 04/08/2014 4 55 DXJF WisdomTree Japan Hedged Financials Sector 04/08/2014 4 56 DXJH WisdomTree Japan Hedged Health Care Sector 04/08/2014 4 57 DXJR WisdomTree Japan Hedged Real Estate Sector 04/08/2014 4 58 DXJT WisdomTree Japan Hedged Tech Med & Tel Sector 04/08/2014 4 59 BARS Direxion Daily Gold Bear 3x Shares Inverse 04/10/2014 60 BAR Direxion Daily Gold Bull 3x Shares Leveraged 04/10/2014 61 BCHP EGShares Blue Chip ETF Global/Intl 04/23/2014 62 OSMS Barclays OFI SteelPath MLP ETN Sector 04/24/2014 5 63 BYLD iShares Yield Optimized Bond ETF Bond 04/24/2014 2 64 CN Deutsche X-trackers Hrv MSCI All China Global/Intl 04/30/2014 65 SUBD Deutsche X-trackers Solactive IG Subrd Debt Bond 05/01/2014 66 QAT iShares MSCI Qatar Capped ETF Global/Intl 05/01/2014 67 UAE iShares MSCI UAE Capped ETF Global/Intl 05/01/2014 68 [ VRP PowerShares Variable Rate Preferred Style/Strat 05/01/2014 5 69 EUDG WisdomTree Europe Dividend Growth Global/Intl 05/07/2014 5 70 IHDG WisdomTree Intl Hedged Dividend Growth Global/Intl 05/07/2014 5 71 FMB First Trust Managed Municipal Bond 05/15/2014 1 72 OUNZ Merk Gold Trust Commodity 05/16/2014 73 ASHS Deutsche X-trackers Hrv CSI 500 China A Sml Global/Intl 05/21/2014 74 SPUU Direxion Daily S&P 500 Bull 2x Shares Leveraged 05/28/2014 75 IBDF iShares iBonds Dec 2016 Corporate Term Bond 05/29/2014 76 IBDH iShares iBonds Dec 2018 Corporate Term Bond 05/29/2014 77 LQDH iShares Interest Rate Hedged Corporate Bond Bond 05/29/2014 1,2,4 78 HYGH iShares Interest Rate Hedged High Yield Bond Bond 05/29/2014 1,2,4 79 LALT PowerShares Multi-Strategy Alternative Style/Strat 05/29/2014 1,4 80 AXJV iShares MSCI Asia ex Japan Minimum Vlty Global/Intl 06/05/2014 81 EUMV iShares MSCI Europe Minimum Volatility Global/Intl 06/05/2014 82 JPMV iShares MSCI Japan Minimum Volatility Global/Intl 06/05/2014 83 SMEZ SPDR EURO STOXX Small Cap Global/Intl 06/05/2014 84 QEFA SPDR MSCI EAFE Quality Mix Global/Intl 06/05/2014 85 QEMM SPDR MSCI Emerging Markets Quality Mix Global/Intl 06/05/2014 86 QWLD SPDR MSCI World Quality Mix Global/Intl 06/05/2014 87 FLGE Credit Suisse FI Large Cap Growth Enh ETN Leveraged 06/11/2014 88 FMLP ETRACS Wells Fargo MLP Ex-Energy ETN Style/Strat 06/11/2014 5 89 FBGX UBS AG FI Enhanced Large Cap Growth ETN Leveraged 06/11/2014 90 DGRO iShares Core Dividend Growth Style/Strat 06/12/2014 5 91 IEUR iShares Core MSCI Europe Global/Intl 06/12/2014 92 IPAC iShares Core MSCI Pacific Global/Intl 06/12/2014 93 IUSB iShares Core Total USD Bond Market Bond 06/12/2014 94 QAUS SPDR MSCI Australia Quality Mix Global/Intl 06/12/2014 95 QCAN SPDR MSCI Canada Quality Mix Global/Intl 06/12/2014 96 QDEU SPDR MSCI Germany Quality Mix Global/Intl 06/12/2014 97 QJPN SPDR MSCI Japan Quality Mix Global/Intl 06/12/2014 98 QESP SPDR MSCI Spain Quality Mix Global/Intl 06/12/2014 99 QGBR SPDR MSCI United Kingdom Quality Mix Global/Intl 06/12/2014 100 JPGE JPMorgan Diversified Return Global Equity Global/Intl 06/17/2014 101 LMLP ETRACS Mthly Pay 2x WF MLP Ex-Engy ETN Leveraged 06/25/2014 5 102 CFO Compass EMP U.S. 500 Enh Volatility Wtd Style/Strat 07/02/2014 103 CFA Compass EMP U.S. 500 Volatility Weighted Style/Strat 07/02/2014 104 CDC Compass EMP U.S. Eq Inc 100 Enh Vlty Wtd Style/Strat 07/02/2014 5 105 MULT AdvisorShares Sunrise Global Multi-Strategy Style/Strat 07/09/2014 1,2,4 106 WIL Barclays Women in Leadership ETN Style/Strat 07/10/2014 107 HEZU iShares Currency Hedged MSCI EMU Global/Intl 07/10/2014 2,4 108 REET iShares Global REIT Sector 07/10/2014 109 CFGE Calamos Focused Growth Style/Strat 07/14/2014 1 110 TAPR Barclays Inverse U.S. Treasury Aggregate ETN Inverse 07/15/2014 111 OTC:SGDM Sprott Gold Miners ETF Sector 07/15/2014 112 IFV First Trust Dorsey Wright Intl Focus 5 Global/Intl 07/23/2014 2 113 CNXT Market Vectors ChinaAMC SME-ChiNext Global/Intl 07/24/2014 114 SYTL Direxion Daily 7-10 Year Treasury Bull 2x Leveraged 07/29/2014 115 MDLL Direxion Daily Mid Cap Bull 2x Leveraged 07/29/2014 116 SMLL Direxion Daily Small Cap Bull 2x Leveraged 07/29/2014 117 YGRO RBC Yorkville MLP Dist Growth Ldrs Liq PR ETN Sector 07/29/2014 5 118 DIVI AdvisorShares Athena High Dividend Global/Intl 07/30/2014 1,5 119 CSF Compass EMP U.S. Discovery 500 Enh VltyWtd Style/Strat 08/01/2014 120 IBLN Direxion iBillionaire Index ETF Style/Strat 08/01/2014 121 FTSM First Trust Enhanced Short Maturity ETF Bond 08/06/2014 1 122 TYTE ProShares CDS North American HY Credit Bond 08/07/2014 1 123 WYDE ProShares CDS Short North Amer HY Credit Bond 08/07/2014 1 124 FDIV First Trust Strategic Income ETF Style/Strat 08/14/2014 1,5 125 IBMI iShares iBonds Sep 2020 AMT-Free Muni Bond Bond 08/14/2014 126 EFAD ProShares MSCI EAFE Dividend Growers Global/Intl 08/21/2014 5 127 WBIE WBI Large Cap Tactical Growth Shares Style/Strat 08/27/2014 1 128 WBIL WBI Large Cap Tactical Select Shares Style/Strat 08/27/2014 1 129 WBIF WBI Large Cap Tactical Value Shares Style/Strat 08/27/2014 1 130 WBIG WBI Large Cap Tactical Yield Shares Style/Strat 08/27/2014 1,5 131 WBIA WBI SMID Tactical Growth Shares Style/Strat 08/27/2014 1 132 WBID WBI SMID Tactical Select Shares Style/Strat 08/27/2014 1 133 WBIB WBI SMID Tactical Value Shares Style/Strat 08/27/2014 1 134 WBIC WBI SMID Tactical Yield Shares Style/Strat 08/27/2014 1,5 135 WBIH WBI Tactical High Income Shares Style/Strat 08/27/2014 1,5 136 WBII WBI Tactical Income Shares Style/Strat 08/27/2014 1,5 137 MBSD FlexShares Disciplined Duration MBS Index Bond 09/04/2014 138 FTLS First Trust Long/Short Equity ETF Style/Strat 09/09/2014 1,4 139 LDRI PowerShares LadderRite 0-5 Year Corp Bond Bond 09/10/2014 140 RORO SPDR SSgA Risk Aware ETF Style/Strat 09/10/2014 1 141 RODI Barclays Return on Disability ETN Style/Strat 09/11/2014 142 DIVC C-Tracks Miller/Howard Strat Div Reinvst ETN Style/Strat 09/16/2014 5 143 TOFR Stock Split Index Fund Style/Strat 09/16/2014 144 BSJL Guggenheim BulletShares 2021 HY Corp Bond Bond 09/17/2014 145 BSJM Guggenheim BulletShares 2022 HY Corp Bond Bond 09/17/2014 146 BSCN Guggenheim BulletShares 2023 Corp Bond Bond 09/17/2014 147 OTC:BSCO Guggenheim BulletShares 2024 Corp Bond Bond 09/17/2014 148 QMEX SPDR MSCI Mexico Quality Mix ETF Global/Intl 09/18/2014 149 QKOR SPDR MSCI South Korea Quality Mix ETF Global/Intl 09/18/2014 150 QTWN SPDR MSCI Taiwan Quality Mix ETF Global/Intl 09/18/2014 151 DVP Deep Value ETF Style/Strat 09/23/2014 152 ESTX Source EURO STOXX 50 ETF Global/Intl 09/23/2014 153 HEEM iShares Currency Hedged MSCI Emerg Mkts Global/Intl 09/25/2014 2,4 154 EMRE Guggenheim Emerging Markets Real Estate Sector 09/29/2014 155 ARKQ ARK Industrial Innovation ETF Sector 09/30/2014 1 156 ARKW ARK Web x.0 ETF Sector 09/30/2014 1 157 DWAT Arrow DWA Tactical ETF Style/Strat 10/01/2014 1,2,4 158 CIZ Compass EMP Developed 500 Enh Vlty Wtd Global/Intl 10/01/2014 159 HDLV ETRACS Mthly Pay 2xUS HighDiv Low Vlty ETN Leveraged 10/01/2014 5 160 FIA Falah Russell-IdealRatings U.S. Large Cap Style/Strat 10/02/2014 161 AMZA InfraCap MLP ETF (C-Corp) Sector 10/02/2014 1,3,5 162 FUTS ProShares Managed Futures Strategy Style/Strat 10/02/2014 4 163 IPOS Renaissance International IPO ETF Global/Intl 10/07/2014 164 FCOR Fidelity Corporate Bond ETF Bond 10/09/2014 1 165 OTC:FLTB Fidelity Limited Term Bond ETF Bond 10/09/2014 1 166 FBND Fidelity Total Bond ETF Bond 10/09/2014 1 167 ALTS ProShares Morningstar Alternatives Solution Style/Strat 10/09/2014 2,4 168 COMT iShares Commodities Select Strategy ETF Sector 10/16/2014 1 169 EMHZ iShares MSCI Emerging Markets Horizon ETF Global/Intl 10/16/2014 170 VBND Vident Core U.S. Bond Strategy ETF Bond 10/16/2014 171 FEUZ First Trust Eurozone AlphaDEX ETF Global/Intl 10/22/2014 172 QVAL ValueShares U.S. Quantitative Value ETF Style/Strat 10/22/2014 1 173 EFFE Global X JPMorgan Efficiente Style/Strat 10/23/2014 2 174 SCTO Global X JPMorgan US Sector Rotator Style/Strat 10/23/2014 2 175 DAX Recon Capital DAX Germany ETF Global/Intl 10/23/2014 176 STXX ALPS STOXX Europe 600 ETF Global/Intl 10/31/2014 177 ARKG ARK Genomic Revolution Multi-Sector ETF Sector 10/31/2014 1 178 ARKK ARK Innovation ETF Style/Strat 10/31/2014 1 179 GMOM Cambria Global Momentum ETF Global/Intl 11/04/2014 1,2 180 FEMB First Trust Emerging Markets Local Bond ETF Bond 11/05/2014 1 181 FPXI First Trust International IPO ETF Global/Intl 11/05/2014 182 LMBS First Trust Low Duration Mortgage Opp Bond 11/05/2014 1 183 JPIN JPMorgan Diversified Return International Eq Global/Intl 11/07/2014 184 PDBC PowerShares DB Opt Yld Divers Cmmdty Strat Commodity 11/07/2014 1 185 CBON Market Vectors ChinaAMC China Bond ETF Bond 11/11/2014 186 HACK PureFunds ISE Cyber Security ETF Sector 11/12/2014 187 EMQQ Emerging Markets Internet and Ecommerce Sector 11/13/2014 188 SKOR FlexShares Credit-Scored US Corporate Bond Bond 11/13/2014 189 CHNB Global X China Bond ETF Bond 11/19/2014 190 LOWC SPDR MSCI ACWI Low Carbon Target ETF Global/Intl 11/26/2014 191 MLPO Credit Suisse S&P MLP Index ETN Sector 12/03/2014 5 192 VQTS ETRACS S&P 500 VEQTOR Switch Index ETN Style/Strat 12/03/2014 4 193 KCNY KraneShares E Fund China Commercial Paper Bond 12/03/2014 194 IBDL iShares iBonds Dec 2020 Corporate ETF Bond 12/04/2014 195 CRBN iShares MSCI ACWI Low Carbon Target ETF Global/Intl 12/09/2014 196 GAA Cambria Global Asset Allocation ETF Style/Strat 12/10/2014 197 DBEZ Deutsche X-trackers MSCI EMU Hedged Equity Global/Intl 12/10/2014 4 198 VALX Validea Market Legends ETF Global/Intl 12/10/2014 1 199 XSOE WisdomTree Emg Mktss ex-State-Owned Ent Global/Intl 12/10/2014 200 BBC BioShares Biotechnology Clinical Trials Sector 12/17/2014 201 BBP BioShares Biotechnology Products Sector 12/17/2014 202 IVAL ValueShares International Quantitative Value Global/Intl 12/17/2014 1 203 DIVY Reality Shares DIVS ETF Style/Strat 12/18/2014 1,5 204 EQAL PowerShares Russell 1000 Equal Weight Style/Strat 12/23/2014 205 SBIO ALPS Medical Breakthroughs ETF Sector 12/31/2014 Notes: 1) actively managed, 2) fund-of-funds, 3) structured as a C-Corporation, 4) employs hedging, 5) dividend focus. All exchange traded notes are identified with “ETN” as part of their name description. Disclosure covering writer, editor, publisher, and affiliates: No positions in any of the securities mentioned or listed in the table. No positions in any of the companies or ETF sponsors mentioned. No income, revenue, or other compensation (either directly or indirectly) received from, or on behalf of, any of the companies or ETF sponsors mentioned.


