Tag Archives: fn-end

In Defense Of iShares MSCI Emerging Markets Minimum Volatility ETF

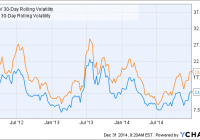
Summary I recently profiled several emerging market low-volatility ETFs and selected EEMV for my own personal portfolio. Last year, another Seeking Alpha author wrote a detailed analysis highlighting the drawbacks of EEMV. This piece considers those drawbacks in light of EEMV’s 3-year performance and also examines the role of the fund in one’s portfolio. Introduction In a previous article , we studied the performance of three low-volatility emerging market (EM) ETFs: EGShares Low Volatility EM Dividend ETF (NYSEARCA: HILO ), PowerShares S&P Emerging Markets Low Volatility Portfolio (NYSEARCA: EELV ) and iShares MSCI Emerging Markets Minimum Volatility (NYSEARCA: EEMV ). We found that all three low-volatility EM ETFs delivered lower volatility than the benchmark iShares MSCI Emerging Markets ETF (NYSEARCA: EEM ) over the past two years, but with wildly disparate returns. EEMV did the best out of the three funds, with a 20.64% return, while EELV returned 8.87%. Also, both funds beat EEM (6.23%). On the other hand, HILO was by far the worst fund with a total return performance of -9.53%. I decided to select EEMV for my own portfolio as it had better sector diversification, greater allocation towards low P/E countries, and the lowest expense ratio out of all the ETFs. In April 2013, around one and a half years after the inception of EEMV, Seeking Alpha author Investment Therapist wrote a detailed analysis that was critical of EEMV for the following four reasons: The methodology of EEMV is constructed without a return focus. Historical volatility is not the best way to obtain low future volatility. EEMV is underdiversified and overconcentrated in low-volatility, high-dividend names, which may underperform in a bull market. The low volatility of EEMV will not protect the fund from a financial crisis. With another 1.5 years under its belt since the date of that article, this fund is now over three years old. This article seeks to address some of the criticisms raised by Investment Therapist in light of the EEMV’s three year performance, and also examines the role of the fund in one’s portfolio. While I disagree with some of his statements, this piece aims not to be combative, but is intended to both clarify my own thinking and to stimulate discussion with the broad readership of Seeking Alpha. 1. The methodology of EEMV is constructed without a return focus. Investment Therapist writes: Basically, the portfolio is being created with an emphasis on volatility and NOT return opportunities. It should go without saying that most rational investors are primarily focused on potential Rewards relative to Risk, and not solely focused on Risk (volatility). By focusing on volatility, the portfolio is created with no outlook on the future return opportunities of the stocks within the portfolio. Investment Therapist is basically saying that volatility has no relationship with future return. However, volatility is a validated factor for alpha. In an April 2012 article by Robeco Asset Management entitled “The volatility effect in emerging markets”, authors Blitz, Pang and Vliet found that from 1988 to 2010, EM stocks that showed lower volatility or lower beta outperformed those with higher volatility or higher beta on a risk-adjusted basis. After adjusting for differences in market beta, the “top-minus-bottom” 1-factor alpha spread between the highest and lowest quintiles of stocks ranked in terms of volatility was determined to be -8.8% per annum. Ranking stocks in terms of beta produced similar results that were less strong (1-factor alpha spread = -5.4%), but still statistically significant. Similar analysis conducted with size, value and momentum (re)confirmed that these premia also operated in emerging markets. Based on the 1-factor alphas, the authors found that the low-volatility premium was much larger than the size premium, comparable to the value premium, but smaller than the momentum premium. Low-volatility stocks also tend to be larger and more mature companies, which could possibly predispose them towards value rather than growth exposure. Was the low volatility premium simply due to an increased exposure to the value factor? To address this, the authors calculated 3-factor and 4-factor alphas for their sample. They found that the 3-factor alphas were very similar to the 1-factor alphas, indicating that exposures to size or value do not explain the higher returns of low-volatility or low-beta stocks in the study. Only the 4-factor alphas were slightly lower, indicating that low-volatility stocks may have indirectly benefited by also showing momentum characteristics (NB: riddle me that!). Therefore, it seems that selecting for low-volatility has been a robust factor for achieving higher risk-adjusted returns. 2. Historical volatility is not the best way to obtain low future volatility. In Robeco’s study of emerging market stocks, the authors stated that “Past risk is again strongly predictive for future risk”. However, Investment Therapist writes: If choosing stocks with low historical volatility and/or low correlations is such a great way of creating a “Minimum Volatility Portfolio,” then why are there over 10 Emerging Market mutual funds that have lower 1-year and Since Inception (of EEMV) volatility than EEMV? Focusing on historical volatility clearly doesn’t produce a portfolio with the lowest volatility. The funds with lower volatility than EEMV focus on the valuation of stocks (determining a stock’s intrinsic value), which EEMV does not since returns are not an input into the construction of the ETF portfolio. Investment Therapist is saying that funds (presumably mutual funds) with a focus on value managed to achieve lower volatility than EEMV over 1-year or since inception (1.5 years). As EEMV is now 3 years old, we can do a longer test of its realized volatility. Note that I shall be using EEM as a benchmark rather than mutual funds as I believe that is a fairer comparison. The graph below shows the 30-day volatility for EEMV and EEM over the past 3 years. EEMV 30-Day Rolling Volatility data by YCharts The results show that EEMV has consistently managed to obtain lower volatility than EEM over the past 3 years. Therefore, it seems that the fund does succeed at producing lower volatility compared to the benchmark. Just for interest, I also report the 2-year volatility and beta values for three EM low-volatility funds (EEMV, EELV and HILO), three EM value funds ( EVAL , PXH , TLTE ), and EEM. The 2-year return of the funds is also shown for comparison. Data are from InvestSpy . Volatility Beta Return EEMV 12.90% 0.81 3.90% EELV 13.30% 0.81 -2.00% HILO 15.30% 0.89 -15.90% Average 13.83% 0.84 -4.67% (NASDAQ: EVAL ) 25.00% 0.57 -5.20% (NYSEARCA: PXH ) 17.90% 1.06 -9.30% (NYSEARCA: TLTE ) 14.70% 0.82 -1.60% Average 19.20% 0.82 -5.37% EEM 16.90% 1.06 -1.40% Interestingly, we find that the three EM value funds actually had higher volatility than the benchmark EEM. Therefore, for passively-managed emerging markets ETFs at least, it seems that value stocks did not possess lower volatilities. 3. EEMV is underdiversified and overconcentrated in low-volatility, high-dividend names, which may underperform in a bull market. Investment Therapist writes: With correlations now coming down and higher yielding investments now approaching the status of “overcrowded trade,” I expect (my opinion) that the same high tracking error that came with the fund on the upside performance will also cause this fund to experience strong pains should a bull market in Emerging Markets form. Overall, once the strong performance over the fund’s very short tenure is examined deeper, it can be seen that the strong stylized bias towards the value-oriented, low-volatility names were a tail-wind to the fund. I do agree with Investment Therapist here. Low-volatility names tend to exist in more mature, stable industries that have a lower capacity for growth. In our previous article, we saw that EEMV was actually more pricey than EEM in terms of its valuation metrics (table reproduced below, data from Morningstar , value metrics are forward-looking). EEMV EEM Price/Earnings 15.69 12.76 Price/Book 1.86 1.49 Price/Sales 1.51 1.14 Price/Cash Flow 7.38 4.91 Dividend yield % 2.81 2.56 Projected Earnings Growth % 10.97 11.76 Historical Earnings Growth % 5.06 -1.68 Sales Growth % -15.60 -13.79 Cash-flow Growth % 6.36 7.85 Book-value Growth % -26.56 -21.57 Since EEMV’s inception, there have been at least two mini-bull markets where EEM climbed by 20% or more. Let’s see how EEMV and its “opposite fund”, the PowerShares S&P Emerging Markets High Beta Portfolio (NYSEARCA: EEHB ), performed over these two time periods. Jun 1st, 2012 to Jan 1st, 2013 EEM Total Return Price data by YCharts Feb 1st, 2014 to Sep 1st, 2014 EEM Total Return Price data by YCharts We can see that in both mini-bull runs, EEMV underperformed the benchmark EEM, while EEHB outperformed. Therefore, I agree with Investment Therapist’s assertion that EEMV would likely underperform EEM in a future bull market. But we should also consider this question: what was the purpose of the low-volatility fund in the first place? No one should have expected such a fund to keep pace with a roaring bull. Instead, a low-volatility fund’s aim should be to reduce equity risk (to a certain extent), resulting in higher risk-adjusted returns. The following table shows the 20-month return, volatility, beta, and maximum drawdown of EEMV, EEHB and EEM (data from InvestSpy ). Volatility Beta Max draw. Return EEMV 13.7% 0.86 -15.90% 7.80% EEHB 25.0% 0.62 -29.90% -12.90% EEM 18.0% 1.16 -18.90% -5.60% We can see that the recent struggles of EM markets has caused EEHB to significantly underperform. EEHB had higher volatility and also greater maximum drawdown over the past 20 months compared to EEMV or EEM. (Note that the beta values are with respect to S&P500 and therefore may n to be applicable). So am I saying to go for high volatility/beta in bull markets, and low volatility/beta in bear markets? Hardly. The first reason is that no one can reliably predict when the next bull or bear market will arrive. The second reason is that if you were to pick a factor to tilt towards in a bull market, wouldn’t you rather choose momentum [such as PowerShares DWA Emerging Market Momentum Portfolio (NYSEARCA: PIE )], which is an academically validated factor for outperformance, rather than high-volatility, an academically validated factor for underperformance? All in all, I don’t think that buying-and-holding EEMV is an inherently flawed decision. This is particularly true for the investor who wants some exposure to emerging markets, but are afraid that they can’t handle the higher volatility of emerging markets. However, for investors with a higher risk tolerance I would recommend also buying PIE and PXH to take advantage of momentum and value premia as well, and for better diversification over the entire market cycle (one could also achieve better diversification by holding EEM). 4. The low volatility of EEMV will not protect the fund from a financial crisis. Investment Therapist writes: Bonds will behave much differently than stocks, even during a financial crisis. A portfolio of stocks, however, wavered during the most recent financial crisis and the lack of “diversification” was made evident. There is no fundamental research proving that this type of optimization would work at the Stock Selection level since a portfolio of stocks behave more similarly than two unique strategies like Bonds and Stocks. I do completely agree with Investment Therapist on this. Low volatility stocks are still stocks, and will move (more or less) as other stocks do. Therefore, investors in EEMV should not expect the fund to hold up during a recession (like a bond would). But again, an investor should be asking the same question: what was the purpose of the low-volatility fund in the first place? What a low-volatility fund will do is to perform better than a neutral or a high-volatility fund during a correction or a bear market. Indeed, (backtested) data shows that MSCI EM Minimum Volatility Index, the underlying index for EEMV, dropped “only” -41.97% in 2008, while the MSCI EM index dropped -53.18%. In more recent and actual data, EEMV held up better than EEM in the September swoon that hit emerging markets this year (strangely, so did EEHB). EEM Total Return Price data by YCharts Conclusion Investment Therapist’s article contained some criticisms on EEMV that, while technically correct, should not unduly worry the investor who recognizes the role and limitations of a low-volatility fund in their portfolio. Yes, EEMV will likely underperform EEM in a bull market and will also likely underperform bonds during a bear market. However, what EEMV will deliver is lower volatility compared to EEM, which is great from a psychological point of view, as well as higher risk-adjusted returns or “alpha” (as long as the low-volatility premium persists, which I will assume to be the case until evidence points otherwise). However, one cautionary note that I will echo Investment Therapist on is that low-volatility stocks are becoming more expensive. Therefore, I recommend that investors with higher risk tolerances should also consider holding EM value funds such as PXH or EM momentum funds such as PIE to harvest other alternative sources of alpha.
Polaris Global Value, December 2014

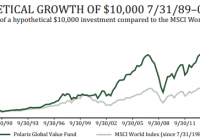
Editor’s note: Originally published on December 1, 2014 Objective and strategy Polaris Global Value attempts to provide above average return by investing in companies with potentially strong sustainable free cash flow or undervalued assets. Their goal is “to invest in the most undervalued companies in the world.” They combine quantitative screens with Graham and Dodd-like fundamental research. The fund is diversified across country, industry and market capitalization. They typically hold 50 to 100 stocks. Adviser Polaris Capital Management, LLC. Founded in 1995, Polaris describes itself as a “global value equity manager.” The firm is owned by its employees and, as of September 2014, managed $5 billion for institutions, retirement plans, insurance companies, foundations, endowments, high-net-worth individuals, investment companies, corporations, pension and profit sharing plans, pooled investment vehicles, charitable organizations, state or municipal governments, and limited partnerships. They subadvise four funds include the value portion of the PNC International Equity, a portion of the Russell Global Equity Fund and two Pear Tree Polaris funds. Manager Bernard Horn. Mr. Horn is Polaris’s founder, president and senior portfolio manager. Mr. Horn founded Polaris in April 1995 to expand his existing client base dating to the early 1980s. Mr. Horn has been managing Polaris’ global and international portfolios since the firm’s inception and global equity portfolios since 1980. He’s both widely published and widely quoted. He earned a BS from Northeastern University and a MS in Management from MIT. In 2007, MarketWatch named him their Fund Manager of the Year. Mr. Horn is assisted by six investment professionals. They report producing 90% of their research in-house. Strategy capacity and closure Substantial. Mr. Horn estimates that they could manage $10 billion firm wide; current assets are at $5 billion across all portfolios and funds. That decision has already cost him one large client who wanted Mr. Horn to increase capacity by managing larger cap portfolios. About half of the global value fund’s current portfolio is in small- to mid-cap stocks and, he reports, “it’s a pretty small- to mid-cap world. Something like 80% of the world’s 39,000 publicly traded companies have market caps under $2 billion.” If this strategy reaches its full capacity, they’ll close it though they might subsequently launch a complementary strategy. Active share Polaris hasn’t calculated it. It’s apt to be high since, they report “only 51% of the stocks in PGVFX overlap with the benchmark” and the fund’s portfolio is equal-weighted while the index is cap-weighted. Management’s stake in the fund Mr. Horn has over $1 million in the fund and owns over 75% of the advisor. Mr. Horn reports that “All my money is invested in the funds that we run. I have no interest in losing my competitive advantage in alpha generation.” In addition, all of the employees of Polaris Capital are invested in the fund. Opening date July 31, 1989. Minimum investment $2,500, reduced to $2,000 for IRAs. That’s rather modest in comparison to the $75 million minimum for their separate accounts. Expense ratio 0.99% on $290 million in assets, as of November 2014. The expense ratio was reduced at the end of 2013, in part to accommodate the needs of institutional investors. With the change, PGVFX has an expense ratio in the bottom third of its peer group. Comments There’s a lot to like about Polaris Global Value. I’ll list four particulars: Polaris has had a great century. $10,000 invested in the fund on January 1, 2000 would have grown to $36,600 by the end of November 2014. Its average global stock peer was pathetic by comparison, growing $10,000 to just $16,700. Focus for a minute on the amount added to that initial investment: Polaris added $26,600 to your wealth while the average fund would have added $6,700. That’s a 4:1 difference. It’s doggedly independent. Its median market cap – $8 billion – is about one-fifth of its peers’. The stocks in its portfolio are all about equally weighted while its peers are much closer to being cap weighted. It has substantially less in Asia and the U.S. (50%) than its peers (70%), offset by a far higher weighting in Europe. Likewise its sector weightings are comparable to its peers in only two of 11 sectors. All of that translates to returns unrelated to its peers: in 1998 it lost 9% while its peers made 24% but it made money in both 2001 and 2002 while its peers lost a third of their money. It’s driven by alpha, not assets. The marketing for Polaris is modest, the fund is small, and the managers have been content having most of their assets reside in their various sub-advised funds. It’s tax efficient. Through careful management, the fund hasn’t had a capital gains payout in years; nothing since 2008 at least and Mr. Horn reports a continuing tax loss carry forward to offset still more gains. The one fly in the ointment was the fund’s performance in the 2007-09 market meltdown. To be blunt, it was horrendous. Between October 2007 and March 2009, Polaris transformed a $10,000 account into a $3,600 account which explains the fund’s excellent tax efficiency in recent years. The drop was so severe that it wiped out all of the gains made in the preceding seven years. Here’s the visual representation of the fund’s progress since inception. Okay, if that one six quarter period didn’t exist, Polaris would be about the world’s finest fund and Mr. Horn wouldn’t have any explaining to do. Sadly, that tumble off a cliff does exist and we called Mr. Horn to talk about what happened then and what he’s done about it. Here’s the short version: “2008 was a bit of an unusual year. The strangest thing is that we had the same kinds of companies we had in the dot.com bubble and were similarly overweight in industrials, materials and banks. The Lehman bankruptcy scared everyone out of the market, you’ll recall that even money market funds froze up, and the panic hit worst in financials and industrials with their high capital demands.” Like Dodge & Cox, Polaris was buying when prices were at their low point in a generation, only to watch them fall to a three generation low. Their research screens “exploded with values – over a couple thousand stocks passed our initial screens.” Their faith was rewarded with 62% gains over the following two years. The experience led Mr. Horn and his team to increase the rigor of their screening. They had, for example, been modeling what would happen to a stock if a firm’s growth flat lined. “Our screens are pretty pessimistic; they’re designed to offer very, very conservative financial models of these companies” but 2008 sort of blindsided them. Now they’re modeling ten and twenty percent declines as a sort of stress test. They found about five portfolio companies that failed those tests and which they “kinda got rid of, though they bounced back quite nicely afterward.” In addition they’ve taken the unconventional step of hiring private investigators (“a bunch of former FBI guys”) to help with their due diligence on corporate management, especially when it comes to non-U.S. firms. He believes that the “soul-searching after 2008” and a bunch of changes in their qualitative approach, in particular greater vigilance for the sorts of low visibility risks occasioned by highly-interconnected markets, has allowed them to fundamentally strengthen their risk management. As he looks ahead, two factors are shaping his thinking about the portfolio: deflation and China. On deflation: “We think the developed world is truly in a period of deflation. One thing we learned in investing in Japan for the past 5 plus years, we were able to find companies that were able to raise their operating revenue and free cash flows during what most central bankers would consider the scourge of the economic Earth.” He expects very few industries to be able to raise prices in real terms, so the team is focusing on identifying deflation beating companies. The shared characteristic of those firms is that they’re able to – or they help make it possible for other firms – to lower operating costs by more than the amount revenues will fall. “If you can offer a company product that saves them money – only salvation is lowering cost more dramatically than top line is sinking – you will sell lots.” On China: “There’s a potential problem in China; we saw lots of half completed buildings with no activity at all, no supplies being delivered, no workers – and we had to ask, why? There are many very, very smart people who are aware of the situation but claim that we’re more worried than we need to be. On whole, Chinese firms seem more sanguine. But no one offers good answers to our concerns.” Mr. Horn thinks that China, along with the U.S. and Japan, are the world’s most attractive markets right now. Still he sees them as a potential source of a black swan event, perhaps arising from the unintended consequences of corruption crackdowns, the government ownership of the entire banking sector or their record gold purchases as they move to make their currency fully convertible on the world market. He’s actively looking for ways to guard against potential surprises from that direction. Bottom Line There’s a Latin phrase often misascribed to the 87-year-old titan, Michelangelo: Ancora imparo . It’s reputedly the humble admission by one of history’s greatest intellects that “I am still learning.” After an hour-long conversation with Mr. Horn, that very phrase came to mind. He has a remarkably probing, restless, wide-ranging intellect. He’s thinking about important challenges and articulating awfully sensible responses. The mess in 2008 left him neither dismissive nor defensive. He described and diagnosed the problem in clear, sharp terms and took responsibility (“shame on us”) for not getting ahead of it. He seems to have vigorously pursued strategies that make his portfolio better positioned. It was a conversation that inspired our confidence and it’s a fund that warrants your attention. Fund website: Polaris Global Value Disclosure : No positions

When To Rebalance Your Portfolio

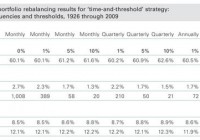
It’s that time of year again. Time to look at your portfolio and decide on your rebalancing strategy. Most investors know they should rebalance but many don’t do it or they get hung up on the detailed mechanics of rebalancing. In this post I’ll present a quick summary of rebalancing approaches and share my approach as well. We rebalance portfolios to improve risk adjusted returns over the long haul. In general, if portfolios are not rebalanced then the equity portion of the portfolio grows to dominate the overall portfolio and its risk. This is usually not something investors want especially as they age. After the decision to rebalance, the next question is how often. The frequency of rebalancing has to be traded off with the costs of rebalancing, transaction fees, commissions, etc… We also need to consider if we should rebalance if there is any difference at all in our target percentage allocations or wait until there is a significant enough difference to trigger an allocation decision. Say your target is 60% stocks and at the end the year you end up at 61% stocks. Does the benefit of rebalancing outweigh the costs? Probably not in this case. So, how does an investor choose the best approach? Fortunately, the great folks at Vanguard have done all the heavy lifting for us in this paper. Here is the summary table. (click to enlarge) As the above table shows basically there is not a big difference in rebalancing approaches, outside of never rebalancing. Even a monthly rebalance with a 0% threshold does not increase portfolio turnover and costs as much as you would expect. The last column also shows the results of never rebalancing – higher returns but with significantly higher volatility which leads to portfolio outcomes that most investors cannot stick with over time. These results also hold for quant portfolios. Whether implementing the IVY portfolios, the Permanent portfolios, Quant portfolios, the timing and threshold of the rebalance does not make a significant difference to long-term portfolio returns, e.g. see the IVY portfolio FAQ question #4. However, it is important to point out that there are periods where rebalancing does not work. Let me give you an example. The table below compares the returns of 60/40 stock bond and 70/30 stock bond portfolios with yearly rebalancing and no rebalancing over the last 5 years (2009 to 2013). (click to enlarge) As the table shows, yearly rebalancing increased returns for the 60/40 portfolio but yearly rebalancing actually decreased returns for the more aggressive 70/30 portfolio. This is typical in strong bull markets when stocks consistently outperform. This is maybe one of the reasons investors abandon rebalancing. But it is important to focus on the long term and more importantly on risk adjusted returns and stick to a rebalancing strategy. Personally, I rebalance once a year with a 1% threshold across all my portfolios regardless of strategy. But that is what I have found works for me. The best advice I can give anyone is to paraphrase the Vanguard advice – choose a regular periodic rebalancing approach that fits your investment style and that you can stick with over the long haul. This is most likely my last post for this year. Hope everyone has a Happy New Year! Here is to a great and prosperous 2015. At the beginning of the year I’ll be focusing on updating all the yearly returns for all the portfolios and strategies I track. I’m looking forward to sharing the results with everyone.