Buy Energy CEFs With Large Distributions And Steep Discounts To Play An Oil Rebound
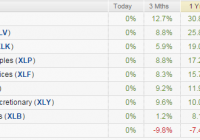
Summary Energy was the worst performing sector in 2014. Year end tax loss harvesting driven both energy stocks and CEFs lower setting up a potential for a strong rebound. Funds are available with distributions as high as 12.16% and discounts as wide as 14.85%. Overview: After a strong start to 2014, energy stocks slid in the second half driving energy to be the worst performing sector of the year. Source: Seeking Alpha 1/1/2015 Oil prices have suffered due to the stronger dollar and OPEC’s decision not to cut oil production. The iPath S&P GSCI Crude Oil ETN (NYSEARCA: OIL ), which follows the price of west Texas intermediate crude oil, fell 51% from a high of $25.96 on June 20, 2014 to close the year at $12.54. This large fall in oil prices put significant pressure on energy stocks. There is much debate about what energy prices will do in 2015. Geopolitical risk doesn’t seem to be decreasing and could drive large spikes in oil prices if issues in the Middle East or Russia flare up during the year. On the other side, U.S. energy companies are only now starting to cut capital budgets. U.S. production levels are still expected to be higher in 2015 than in 2014. U.S. production growth combined with stable output from OPEC nations could continue to pressure oil prices. Another variable will be global economic growth. The United States has seen economic growth strengthen, while Europe continues and China’s growth rate has continued to slow. If the global economy is able to strengthen in 2015 it would support oil prices. Energy stock’s move lower has improved the energy sector’s attractiveness relative to the S&P 500. Using the Energy Select Sector SPDR (NYSEARCA: XLE ) to represent energy stocks, we see that energy offers a higher dividend yield with lower price to earnings and price to book ratios than the SPDR S&P 500 Trust ETF (NYSEARCA: SPY ). However, forward growth expectations for the energy sector are lower than the S&P 500. 5 year forward growth expectations for energy have fallen from 12.73% in September to 10.21% now as analysts have cut their expectations due to lower oil prices. Source: State Street Global Advisors 1/1/2015 The move lower in energy stocks also impacted closed end funds investing in energy. The funds offer attractive yields and continue to trade at wide discounts to underlying net asset values. Investors looking to add to energy holdings in 2015 would be wise to look at CEFs as a way to buy $1.00 of assets for $.90 or less. Investors could also see an added boost as year end tax loss harvesting has affected both the closed end funds and the underlying securities. This could set up an interesting rebound if oil can stabilize. Closed end funds also offer attractive distributions. Some of the funds use options strategies to decrease risk increase distributions. Energy stocks remain attractive long term and offer one of the better values in a stock market hitting all time highs. Energy is also an attractive investment as most investors are naturally hedged. Energy is used to fuel their car or heat their homes. If energy prices fall, energy consumption costs will move lower, helping to offset losses in their investment portfolio. If energy prices rise, investors should see better performance in their investment portfolio to help cushion the increased cost at the pump. Gasoline prices have fallen along with oil and now could be an attractive point to increase this hedge in investors portfolios. The graphic below lists several metrics that can help quickly evaluate closed-end funds including distribution, leverage, premium/discount, 1 Year Z-Statistic (from Morningstar), historic returns, and fund expense ratios. Data for XLE and the iShares Global Energy ETF (NYSEARCA: IXC ) are also included to provide ETF options for investing in the same space. Data for the SPY is included to offer information for the broader market. The ETF results can also be used as a benchmark to evaluate performance. (click to enlarge) Source: Morningstar 1/1/2015 All of the energy CEFs showed negative performance for the last three months. There was a wide range of performance from the Voya Natural Resources Equity Income Fund (NYSE: IRR ) posting the best return of -14.18% to Tortoise Energy Independence (NYSE: NDP ) posting a -21.58% NAV return. CEF discounts have remained pretty close to their levels at the end of Q3. The most notable exception was BlackRock Energy & Resources (NYSE: BGR ) which saw its discount narrow to 5.67% from 10.75%. The relatively poor performance from BGR in 2014 is a little surprising. The fund is unlevered and uses an options strategy to produce extra income and reduce risk. BGR has a strong management team that has produced relatively attractive returns over longer periods particularly compared to IXC. IXC is probably the more appropriate benchmark due to the fund’s large exposure to international integrated oil names. BGR’s discount narrowed in the fourth quarter. The narrow current discount reduces the attractiveness of BGR at current prices compared to some of the other CEFs. An in depth profile of BGR is available here . The Cushing Renaissance Fund (NYSE: SZC ) had the strongest performance of energy CEFs during 2014. However, SZC had a difficult fourth quarter. The fund takes a little different approach to energy investing. SZC is focused on companies poised to benefit from increased domestic oil production. The fund invests in both the energy companies working to boost their production, as well as industrial companies that are expected to benefit from lower energy and feedstock costs. This is a broader way to invest in companies poised to benefit from the North American shale revolution. The fund saw a significant slide in the fourth quarter as lower global energy prices reduced the competitive advantage of lower US energy prices. SZC’s price is likely to show the largest reaction of the group to the global economy. The fund could provide some protection against lower energy prices, as it invests in companies that would benefit from the lower prices in addition to E&P companies. The fund saw the discount widen during the forth quarter. The current discount of 12.85 is below the fund’s 1 year average and could offer an opportunity. The widening discount in the fourth quarter also points to some tax loss selling in the fund, which could drive a rebound early in 2015. An in depth profile of SZC is available here . The Petroleum & Resources Corporation (NYSE: PEO ) has been around since 1929 and is the oldest and probably the best known closed end fund in the group. The fund offers the lowest expense ratio in the group. PEO has shown strong longer term performance and provided more downside protection than its peers 2014. The current 13.50% discount to NAV combined with the 7.93% distribution (mostly made up of capital gains) makes this fund an attractive potential addition at current levels. The Tortoise Energy Independence Fund was the worst performing CEF during the fourth quarter. NDP’s focus on North American exploration and production companies investing in shale resources hurt. Shale focused companies were some of the worst performers in the fourth quarter. NDP has a relatively aggressive portfolio due to its focus on shale E&P companies. The fund has the widest discount to NAV in the group at 14.85% and offers an attractive distribution of 9.23%. The fund employs leverage but the ratio appears manageable. The focus on shale E&P companies could make this fund one of the more volatile energy CEFs. Investors looking for a fund with leverage to increasing oil prices should consider this fund. Like BGR, the VOYA Natural Resources Equity Income Fund uses an options strategy. However, IRR’s NAV performance has not impressed during the fund’s life. IRR does has the highest distribution in the group at 12.16%. IRR’s discount widened a bit in the fourth quarter but remains above its one year average. The moderate discount and poor long term performance track record reduces the attractiveness of this fund. Conclusion: Oil prices accelerated their slide in the fourth quarter. The slide in oil prices hurt energy stocks which ended the year as the worst performing sector. Energy stocks could rebound if the global economy picks back up or if the dollar stops its advance. Individual investors may look to add energy sector exposure to hedge their energy use. Energy CEFs with attractive discounts and high distributions are worth consideration for investors looking to add energy exposure. PEO has a long track record with solid performance. The 7.93% distribution and 13.50% discount looks attractive. SZC also looks attractive. It is a broader offering will benefit from domestic energy production and a global economic recovery. NDP is probably the riskiest of the group due to its focus on shale exploration and production companies. If investors are looking for a beta trade NDP’s 14.85% discount and -1.24 Z-score look attractive. The fund is unproven, but invests specifically in companies benefiting from energy production growth in North America. If oil prices rebound NDP could see the most benefit.

