An ERP Retrospective: Looking Back (2014) And Looking Forward (2015)
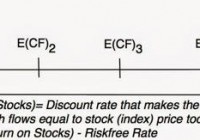
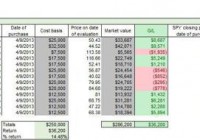
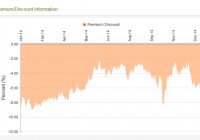
At the beginning of 2014, the expectation was that government bond rates that had been kept low, at least according to the market mythology, by central banks and quantitative easing, would rise and that this would put downward pressure on stocks, which were already richly priced. Perhaps to spite the forecasters, stocks continued to rise in 2014, delivering handsome returns to investors, and government bond rates continued to fall in the US and Europe, notwithstanding the slowing down of quantitative easing. Commodity prices dropped dramatically, with oil plunging by almost 50%, Europe remained the global economic weak link, scaling up growth became more difficult for China and the US economy showed signs of perking up. Now, the sages are back, telling us what is going to happen to markets in 2015 and we continue to give them megaphones, notwithstanding their forecasting history. Rather than do a standard recap, I decided to use my favored device for assessing overall markets, the equity risk premium (ERP), to take a quick trip down memory lane and set up for the year to come. The ERP: Setting the stage The ERP is what investors demand over and above the risk free rate for investing in equities as an asset class. At the risk of sounding over-the-top, if there is one number that captures investors’ hopes, fears and expectations it is this number, and I have not only posted multiple times on it in the last few years but also updated it every month on my website . In making these updates, I have had to confront a key question of how best to measure the ERP. Many practitioners use a historical risk premium, estimated by looking at how much investors have earned on stocks, relative to the returns on something risk free (usually defined as government bills & bonds). Due to the volatility in stock returns, you need very long time periods of data to estimate these premiums, with “long time period” defined as 50, 75 or even 100 years of data. At the start of each year, I estimate the historical risk premiums for the United States and my January 1, 2015 update is below: Based on this table, the historical equity risk premium for the US is between 2.73% to 8%, depending on the time period, risk free rate and averaging approach used. I will also cheerfully admit that I don’t trust or use any of these numbers in my valuations, for three reasons. First, using a historical risk premium requires a belief in mean reversion, i.e., that things will always go back to the way they used to be, that I no longer have. Second, all of these estimates of risk premiums carry large standard errors, ranging from 8.65% for the 2005-2014 estimate (effectively making it pure noise) to 2.32% for the 86-year estimate. Third, it is a static number that changes little as the world changes around you, which you may view as a sign of stability, but I see as denial. In pursuit of a forward-looking, less noisy and dynamic equity risk premium, I drew on a standard metric in the bond market, the yield to maturity: In the equity market analogue, the bond price is replaced with stock index level, the bond coupons with expected cashflows from stocks, with the twist that the cash flows can continue in perpetuity: (click to enlarge) There are both estimation questions (Are cashflows on stocks just dividends, inclusive of buybacks or a broader measure of residual free cashflows to equity?) and challenges (Do you use last year’s cash flow or a normalized value? How do you estimate future growth? How do you deal with a perpetuity?), but they are not insurmountable. In my monthly estimates for the ERP for the S&P 500, here are my default assumptions: (click to enlarge) This estimate is forward-looking, because it is based on expected future cashflows, dynamic, because it changes as stock prices, expected cash flows and interest rates change, and it is surprisingly robust to alternative assumptions about cash flows and growth. The spreadsheet that I use allows you to replace my default assumptions with yours and check the effects in the ERP. The ERP in 2014 Using the framework described in the last section, I estimated an equity risk premium of 4.96% for the S&P 500 on January 1, 2014: (click to enlarge) During 2014, the S&P 500 climbed 11.39% during the year but also allowing for changes in cash flows, growth and the risk free rate, my update from January 1, 2015, yields an implied equity risk premium of 5.78%: (click to enlarge) At the start of each month in 2014, I posted my estimate of the ERP for the S&P 500 on my website. The figure below graphs out the paths followed by the S&P 500 and the ERP through 2014: (click to enlarge) The ERP moved within a fairly narrow band for most of the year, ranging from just under 5% to about 5.5%, with the jump to 5.78% at the end of the year, reflecting the updating of the growth rate. The Drivers of ERP in 2014 To understand the meandering of the ERP during 2014, note that it is determined by four variables: the level of the index, the base year cash flow, the expected growth and the government bond rate, and is a reflection of the risk that investors perceive in equities. In the figure below, I chronicle the changes in these variables during 2014, at least in my ERP estimates. (click to enlarge) A confession is in order. While I update the index levels and government bond rates in real time, I update cashflows once every quarter and the growth rates materially only once a year (at the start of each year). One reason for the precipitous jump in the ERP in the January 1, 2015, update is the updating of the long term growth rate to 5.58% on that date. Updating the cashflow and growth estimates more frequently will smooth out the ERP but not change the starting and ending points. Perspective: Against history and other markets When I stated earlier in the post that the ERP was the one number that encapsulated investor hopes and fears, I was not exaggerating, since every statement about the overall market can be restated in terms of the ERP. Thus, if you believe that the ERP at the start of 2015 is around 5.78% (my estimate but you can replace with yours), your market views can be laid bare by how you answer the following question: Given what you perceive as risk in the market, do you think that 5.78% is a fair premium? If your answer is that it (5.78%) is too low (high), you are telling me that you think stock prices are too high (low). One reason that I posit that I am not a market timer is because I struggle with this question and there are two simple comparisons that I use for comfort. One is to compare the ERP today to implied quit risk premiums in previous years to see how it measures up to historic norms. The figure below summarizes implied equity risk premiums from 1960 to 2014: Looking at the historical numbers, the current ERP looks high, not low; it is close to the norm if you use only the post-2008 time period. It is this argument that I used to contest the notion that the market was in a bubble in June 2014 . The other is to compare the equity risk premium to risk premiums in other asset markets. In the bond market, for instance, the default spread for corporate bonds is a measure of the risk premium and the figure below compares the equity risk premium to the Baa default spreads each year from 1960 to 2014: Again, if history is any indication, equity risk premiums do not look inflated, relative to Baa default spread, though it is entirely possible that both spreads are too low. (You can download the data and check for yourself.) We are and will continue to be inundated by experts, sages and market prognosticators, each wielding their preferred market measures, trying to convince us that markets are under or overvalued. In this New York Times article from December 31, 2014 , looking at where the market stands going into 2015, the writer pointed to two widely followed statistics, the Shiller PE, a measure of how stocks are priced relative to inflation-adjusted earnings, and the Buffett ratio, relating the market cap of US stocks to the US GDP, and suggested that both pointed to an over valued markets. Both Robert Shiller and Warren Buffett are illustrious figures, but I think that both statistics are flawed, the Shiller PE, because it does not control for low interest rates, and the Buffett ratio, because of its failure to factor in the globalization of US companies. On market timing, I prefer to set my own course and am not going to be swayed by celebrity name-power in making my judgments. The Weakest Links If you believe at this point that I am sanguine about what stocks will do next year, you would be wrong. The nature of equity investing is that it is always coupled with worries and that the best laid plans can be destroyed by events out of your control. The notion that stocks always win in the long term is misplaced and there is a reason why we earn a risk premium for investing in equities. Looking at 2015, these are the three biggest dangers that I see: 1. An Earnings Shock? While current stock prices can be justified based on current cash flows, the cash flows to equity investors in 2014, from dividends and buybacks, represented an unusually high percentage of earnings, which, in turn, were at a high watermark, relative to history. Note that US companies paid out 87.58% of earnings to investors, below the 2007 & 2008 levels, but still well above the historical average (73.68%), and the profit margin of 9.84% in 2014 is the highest in the 2001-2014 time period. Both aggregate earnings and the payout ratio will be tested in the year to come. With aggregate earnings, the first test will be in the near term as the dramatic drop in oil prices in 2014 will play havoc with earnings at oil companies. As I noted in my earlier post on oil prices, lower oil prices may create a net positive benefit for the economy, but the immediate earnings benefit to the rest of the market will be modest. The second test may come from slower economic growth. While the US economy looks like it is on the mend, earnings at US companies are increasingly global, and a slowing down of the Chinese economic machine coupled with more stagnation in Europe, may net out to lower earnings. With the payout ratio, the challenge will be to deliver the earnings growth that investors are expecting, while paying out the high percentage of earnings that they are right now. 2. Fear the Fed? I have made this point before in my posts, but it is worth making again. While the equity risk premium has gone up significantly since the pre-2008 crisis, all of the increase in the risk premium has come from the risk free rate dropping and not from expected returns on stocks increasing. (click to enlarge) If the US 10-year T.Bond rate were at 4%, closer to pre-2008 levels, right now, the equity risk premium would be only 3.95%. 3. Crisis, contagion and collapse? If we learned nothing else from 2008, it should be this. We are all part of a global economy, connected at the hip, and while that can yield benefits, the contagion risk has increased, where a crisis in one part of the world spills over into the rest of it. Again drawing on my post on oil, one danger of the sudden collapse in oil prices is that it has not only increased uncertainty about economic growth in the next year but also increased the risk of large, levered oil companies defaulting and sending shockwaves through the rest of the economy. The perfect storm, of course, would be for all three phenomenon to occur together: a drop in earnings and an increase in interest rates, with an overlay of a global crisis, with catastrophic consequences of stocks. I think that the odds of this happening are low, because the circumstances that cause an earnings collapse are the ones that would keep interest rates low, but I may be missing something. If you disagree, you could take the safe route and hold cash, but unless your probability assessments of a crash are high and a crash is imminent, that does not strike me as prudent. (I have reattached the spreadsheet that I developed for my post on bubbles that you can use to make your own assessment.) Bottom line Like every other year in my investing memory, I start this year both hopeful and fearful, hopeful that financial markets will navigate through whatever the new year will throw at them and fearful that there will be something that will rock them. Given what I know now, I don’t see any reason to dramatically alter my exposure to stocks, bonds or real assets, and I will continue to look for stocks that I think are underpriced. I wish you the very best in your investment choices this year as well and I hope that no matter what happens to your portfolio, you are healthy and happy! Attachments: Data Sets Historical Returns for US stocks, T.Bonds and T.Bills: 1928-2014 Implied Equity Risk Premiums for S&P 500: 1960-2014 ERP, Baa Yields and Real Estate Cap Rates: 1960-2014 Spreadsheets Implied ERP Spreadsheet: January 1, 2015 Data Update 2015 Posts An ERP Retrospective: Looking back (2014) and Looking forward (2015)