Tag Archives: fn-end

Africa: Portfolio Worthy?

Originally published on Dec. 17, 2014 The association with Africa in past months is often linked to Ebola. But, don’t let that overshadow the prosperous investment opportunity offered by the continent. Africa is on the rise as witnessed in recent political stability, a growing middle class, and economic growth outpacing most of the world. Indeed, the GDP of Africa has had steady growth since 2000 averaging over 5% each year, and is projected to finish this year up 5.1% and 2015 up 5.8%. Here are three reasons to consider adding African stocks to your portfolio. Rapid Growth in Developed Countries While some countries are still in transition, Nigeria, Kenya, and Mozambique are growing exponentially, with projected GDP growth in 2015 climbing close to the 19% mark. The opportunity seems to be in the water. With China’s recent investment in the South African Ocean economy, other foreign investors are sure to follow suit with these countries’ large shore lines and port communities; there is a huge opportunity for expanded growth. The Major Players China surpassed the United States in import/export business in 2009 and has since been investing their excess liquidity into infrastructure. Heineken ( OTCPK:HINKF ) has been pouring capital expenditures to the tune of $690 million a year to improve facilities and training in Africa. Other well known internationally-based companies such as Nestle ( OTCPK:NSRGF ) and Unilever (NYSE: UL ) also hold profitable investments in Africa. The United States and Canada Although the United States has lagged behind in African investments, the U.S. recently pledged $14 b illion from U.S. businesses such as GE (NYSE: GE ), Marriott (NASDAQ: MAR ), Chevron (NYSE: CVX ), Coca-Cola (NYSE: KO ), IBM (NYSE: IBM ) and MasterCard (NYSE: MA ). Canada’s Actic, a private equity investor in emerging markets, and Cordiant, an emerging market asset manager, most recently launched a $126 million investment fund for Africa. With a growing middle class of 350 million strong in 2010 and home to six nations with the world’s fastest growing economies, Africa is poised to be an attraction for investors looking for positive growth. Sources: http://blog.trade.gov/2014/07/31/u-s-africa-business-success-stories-how-a-supplier-of-powerboats-to-the-u-s-military-started-doing-business-in-nigeria/ http://www.marketwatch.com/story/you-arent-investing-in-africaand-youre-missing-out-2014-12-02 http://www.investopedia.com/articles/investing/112614/etfs-and-mutual-funds-investing-africa.asp http://www.aljazeera.com/news/africa/2014/08/us-announces-14bn-investment-africa-201485155458455909.html http://www.usatoday.com/story/money/personalfinance/2014/08/03/investing-in-africa/13420007/ http://www.reuters.com/article/2014/05/09/us-heineken-nl-africa-idUSBREA480QG20140509 http://www.timeslive.co.za/politics/2014/12/05/chinese-have-invested-r120-billion-in-south-africa-zuma http://www.economist.com/news/finance-and-economics/21575769-strategies-putting-money-work-fast-growing-continent-hottest
Comparing 5 Tactical/Momentum ETFs

Summary Momentum is regarded as the premier anomaly due to its persistent outperformance over long periods of time. With grim clouds presently hanging over today’s stock markets, tactical/momentum ETFs may allow an investor to conduct “passive market timing.” This article is a brief overview of several recently launched tactical/momentum ETFs. Introduction Momentum is often regarded as the premier anomaly due to its persistent outperformance over long periods of time. Stocks that have done well recently tend to continue to do well, while stocks that have done poorly recently tend to continue to do poorly. The momentum concept is embodied in aphorisms such as “Cut your losers and let your winners run.” Interestingly, momentum often runs counter to the tenets of value investing, which champions buying low and selling high. In a one-to-one contest however, the momentum premium beats the value premium hands down. In data presented in an article by GestaltU, the difference between high momentum (Sharpe = 0.58) and low momentum (0.05) stocks was much greater than the difference between value (0.49) and growth (0.23) stocks in the U.S. The p -value of the Sharpe ratio difference for momentum was

iShares Core S&P Small-Cap ETF: IJR’s 2014 And Fourth-Quarter Performance And Seasonality

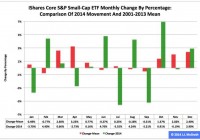
Summary The iShares Core S&P Small-Cap ETF ranked No. 3 in 2014 among the three most popular exchange-traded funds based on the S&P 1500’s constituent indexes. Most recently, the ETF’s adjusted closing daily share price last month ballooned to $114.06 from $110.85, a swelling of $3.21, or 2.90 percent. Seasonality analysis indicates the fund may move to relative weakness in the first quarter from absolute strength in the fourth quarter. The iShares Core S&P Small-Cap ETF (NYSEARCA: IJR ) ranked third by return during 2014 among the three most popular ETFs based on the S&P 1500’s constituent indexes, as it was handily outdistanced by both the SPDR S&P 500 Trust ETF (NYSEARCA: SPY ) and the SPDR S&P MidCap 400 ETF (NYSEARCA: MDY ). Measured by adjusted closing daily share prices, IJR progressed to $114.06 from $107.76, a yield of $6.30, or 5.85 percent. As a result, the small-capitalization ETF lagged the large-cap SPY by -7.62 percentage points and the middle-cap MDY by -3.55 percentage points. However, role reversal in the fourth quarter had IJR leading SPY by 4.90 percentage points and MDY by 3.49 percentage points, as the small-cap ETF soared $10.18, or 9.80 percent. Accounting for its three-to-one share split in 2005, IJR intraday Dec. 31 hit an all-time high of $115.74, a level I consider important because of its proximity to the estimate presented in my “SPY, MDY And IJR At The Fed’s QE3+ Market Top” last March. With the U.S. Federal Reserve actually announcing the end of its latest quantitative-easing program, aka QE3+, Oct. 29 and potentially announcing the beginning of its interest-rate hikes April 29, market participants may be more likely to sell than to buy IJR this quarter. It is worth noting in this context that the Fed’s conclusion of asset purchases under its first two formal QE programs this century is associated with bear markets in small-cap equities , as evidenced by the iShares Russell 2000 ETF (NYSEARCA: IWM ) sliding -21.43 percent in 2010 and -30.78 percent in 2011. Figure 1: IJR Monthly Change, 2014 Vs. 2001-2013 Mean (click to enlarge) Source: This J.J.’s Risky Business chart is based on analyses of adjusted closing monthly share prices at Yahoo Finance . IJR behaved a lot worse in 2014 than it did during its initial 13 full years of existence based on the monthly means calculated by employing data associated with that historical time frame (Figure 1). The same data set shows the average year’s weakest quarter was the third, with a relatively small negative return, and its strongest quarter was the fourth, with an absolutely large positive return. Generally consistent with this pattern, the ETF last year booked a huge loss in Q3 and a huge gain in Q4. Figure 2: IJR Monthly Change, 2014 Vs. 2001-2013 Median (click to enlarge) Source: This J.J.’s Risky Business chart is based on analyses of adjusted closing monthly share prices at Yahoo Finance. IJR performed even more worse in 2014 than it did during its initial 13 full years of existence based on the monthly medians calculated by using data associated with that historical time frame (Figure 2). The same data set shows the average year’s weakest quarter was the third, with a relatively small positive return, and its strongest quarter was the fourth, with an absolutely large positive return. It also shows there is no historical statistical tendency for the ETF to explode in Q1. Meanwhile, the small-cap category of the equity market continues to look grossly overvalued, with the Russell 2000’s price-to-earnings ratio on a trailing 12-month basis calculated as 61.83 Jan. 2, according to Birinyi Associates data published by The Wall Street Journal . Disclaimer: The opinions expressed herein by the author do not constitute an investment recommendation, and they are unsuitable for employment in the making of investment decisions. The opinions expressed herein address only certain aspects of potential investment in any securities and cannot substitute for comprehensive investment analysis. The opinions expressed herein are based on an incomplete set of information, illustrative in nature, and limited in scope. In addition, the opinions expressed herein reflect the author’s best judgment as of the date of publication, and they are subject to change without notice.