Tag Archives: fn-end

American Electric Power Retains Attractiveness For Dividend Seekers

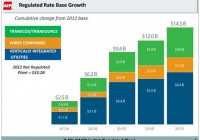
Summary AEP could sell competitive energy operations if weakness continues to persist in the segment’s performance despite long-term pricing agreements. AEP’s capital expenditures will fuel rate based and bottom-line growth in coming years. Stock’s dividend yield of 3.6% is backed by its cash flows. American Electric Power (NYSE: AEP ) has remained an admired investment option for dividend-seeking investors due to its high dividend yield, which is backed by its cash flows. Also, the company is expected to experience healthy earnings growth in the future, driven by capital expenditure that AEP is making to expand its transmission operations. The company expects to experience regulated rate base growth of 7.5% on average until 2017. Separately, AEP has been considering several options to address challenges faced by its competitive energy operations, including the sale of competitive assets, which will positively affect its bottom-line numbers growth. Earnings growth due to the expansion of regulated energy operations will improve bottom-line growth, and hence strengthen cash flows, which will support dividend growth for AEP in the coming years. Therefore, I believe AEP will deliver a healthy financial performance in 2015, which will positively affect the stock price. Healthy Growth Outlook AEP has made the correct strategic decision to address challenges faced by the company in the competitive energy segment; the company’s competitive energy operations have been adversely affected due to low and volatile forward power prices. AEP is looking for a reliable long-term price agreement to stabilize revenues for the segment. And if the long term pricing agreement does not help AEP address challenges faced by the segment, I believe the company will choose to sell its competitive energy assets. The company recently announced that Goldman Sachs will assist AEP in considering options for its competitive energy operations. AEP’s director of external communication, McHenry said, “We haven’t made a decision about whether or not we’re going to sell them, we’re looking at a variety of options.” Duke Energy (NYSE: DUK ) and PPL Corp. (NYSE: PPL ) are among the leading U.S. utility companies that have sold their competitive energy assets due to the ongoing challenges. Along with its efforts to improve competitive energy operations, AEP has been making capital expenditures to grow it regulated operations, which will improve its top and bottom-line growths in the future. The following table shows the capital expenditures that AEP expects to incur from 2015-2017. 2015 2016 2017 Capital Expenditure ($ -billions) $4.4 billion $3.8 billion $3.9 billion Source: Yahoo Finance Also, the company’s regulated rate base growth is expected to increase at an average rate of 7.5% until 2017, due to the capital expenditures it has been making. The increase in regulated operations will also positively affect the stock price. The following chart shows the rate base growth for AEP from 2013-2017. Source: Company Reports Also, the company has been focusing on reducing its costs. AEP has been working to manage and reduce its operational and maintenance costs, which will help offset the weak results of competitive energy operations and support its long-term bottom-line growth. EPS growth for the company is expected to remain in a range of 4%-6% in the long term, as shown below in the chart. Also, the company is expecting its operating earnings for 2014 to in a range of $3.40-$3.50 per share. Source: Company Reports Healthy Dividends The company has been sharing its success with shareholders through dividends. The company offers a dividend yield of 3.60%, which is backed by its cash flows. Also, the company has consistently increased dividends at an average rate of 4% from 2005-2014. The following chart shows the dividend increases for AEP over the years. Source: Company Reports The following table shows the dividend payout ratio and dividend coverage for AEP from 2012-2014 (Dividend coverage = Operating Cash Flows/Dividends). 2012 2013 2014 Dividend Payout Ratio 60% 60% 55% Dividend Coverage 4.1x 4.5x 4x Source: Calculations and Companies Reports As the company has been making efforts to improve its operations through increasing regulated energy operations, its cash flows will be positively affected, which will help AEP increase its dividends at a healthy pace in the coming years. Due to its safe and healthy dividends, the stock remains a good investment option for dividend-seeking investors. Conclusion As competitive energy operations remain weak, AEP has been taking the correct strategic decisions to improve its performance. There is a possibility that AEP might choose to sell its competitive energy operations, if the weakness continues to persistent in the segment’s performance despite long-term pricing agreements. The capital expenditures that AEP is making will fuel its rate base and bottom-line growth in the coming years. And the stock’s dividend yield of 3.6%, backed by its cash flows, makes it a good investment option for dividend-seeking investors. Due to the aforementioned factors, I am bullish on AEP.
The Best Japan ETF For The Long-Term, Hint: It’s Not DXJ

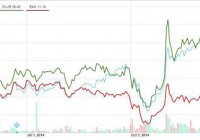
Summary I examine the Japan Hedged Real Estate ETF. I compared the performance of the Japan Hedged Real Estate ETF to the DXJ, and the un-hedged EWJ. Based on the policies of the BOJ, and Japan’s Pension fund, along with the underlying fundamentals I believe the Japan Hedged Real Estate ETF will be a long-term winner. In this article, I will be conducting an overview of a unique ETF that I believe is currently in the sweet spot for potential long-term gains. The WisdomTree Japan Hedged Real Estate ETF (NYSEARCA: DXJR ) I believe is worth considering because of the monetary stimulus that the Bank of Japan [BOJ] initiated in late October, in addition to increased buying of REITS and real estate equities from Japan’s Government Pension Investment Fund [GPIF]. DXJR Fund Facts Index Description The Index and the Fund are designed to provide exposure to Real Estate companies in Japan, while at the same time hedging exposure to fluctuations between the value of the U.S. dollar and the Japanese yen. [ DXJR Fund Page ] Assets: $35.3 million Expense Ratio: 0.43% SEC 30-Day Yield: 1.13% Inception Date: 4/8/2014 DXJR Performance I went to ETF.com and used their ETF Finder to see how the performance of DXJR compared to other Japan related ETFs. I excluded leveraged & inverse funds from my search, and found there were 19 Japan related ETFs. I compared the performance of DXJR since its inception, to the un-hedged iShares MSCI Japan ETF (NYSEARCA: EWJ ), and the largest hedged Japan ETF, the WisdomTree Japan Hedged Equity ETF (NYSEARCA: DXJ ). The chart below shows that since inception, DXJR has significantly outperformed EWJ, and has modestly outperformed the DXJ. The chart clearly shows that in an environment where the BOJ is easing, and Yen is weakening, a currency hedged ETF is the best option. (click to enlarge) Why DXJR Over DXJ? Someone may pose the question, why consider the DXJR which has only $35 million in assets, compared to DXJ which has over $11.5 billion in assets? Both ETFs will benefit from the GPIF allocating more to equities & real estate, and both will benefit from having a hedge to profit from the weakening Yen. The big difference that I believe will lead to DXJR outperforming DXJ is the supply of real estate. Supply Shortage For example, there was an article earlier this year from the WSJ, which, talked about an office space shortage, or this article from Japan Property Central about a severe shortage in apartments. Putting it in simple terms and stating the obvious, Japan is an island, therefore there is a limited supply of available land, and the only way to get around that fact is to build vertically. In a CNBC interview Daisuke Kitai who is the spokesperson at Nomura Real Estate Development stated: The availability of plots large enough to build new apartment complexes in central Tokyo is very limited. As I stated above, the only way to go is to build vertically, however, based on the statement from Mr. Kitai, it is easy to see why there is a shortage of apartments. Foreign Buying Mr. Kitai also brought up another source of demand that is leading to a shortage and that is increased buying from foreign buyers. Mr. Kitai made two statements, which show that there is demand from foreign buyers for Japanese real estate. Based on these statements its easy to see that foreign buyers will continue to properties in Japan, and with the yen weakening foreign buyers who are buying with a stronger currency will get more bang for their buck. Tokyo prices look relatively reasonable compared with similar quality properties in Hong Kong and Singapore. Of the seventy properties sold in the Toranomon Hills complex this summer, 30 percent were sold to foreigners, many from Hong Kong and Taiwan. Estate Planning The final reason why there is a supply shortage is the aging population of Japan is buying properties to minimize inheritance taxes. Also from the CNBC interview Kosei Ajima who is the general manager of property developer Mori Building Co stated: Many Japanese are buying an apartment as a gift to their children to minimize the eventual inheritance tax burden. With the population of Japan aging fast, I would expect there to be continued buying from Japanese citizens who are looking to leave their children with a lower tax bill. Closing Thoughts In closing, I believe the combination of the underlying fundamentals of the Japanese real estate, buying of REITS and real estate stocks by the GPIF, and the BOJ continuing to weaken the yen will lead to long-term gains for DXJR. For someone considering DXJR remember that the ETF has low volume, therefore it would be wise to use limit orders. Disclaimer: See here .

Portfolio Update: Buying More PMs

Please note that this post is a little outdated due to the recent holiday break. Usually, I try to update the trades opened within the 24 hours from execution, but in recent times I haven’t been anywhere near the office (apart from an hour here or there). I did open two new trades just before New Year’s eve, so here is the update as well as a brief thinking process. Chart 1: Gold has shown incredible relative strength during the USD rally! Source: Short Side of Long Unless you have been living in a cave or under a rock, you surely would have noticed the amazing strength the U.S. Dollar has been showing in recent months. Whether it’s against the majors like the Euro, the Yen or the Australian dollar, or EM currencies such as the Ruble or Real, the greenback has been making up some serious ground. If we observe Chart 1, we should be able to see four major global macro asset classes: S&P 500, Treasury Long Bond, USD Index and Gold. Let us not focus on the stock and bond market for a second, and only pay attention to the recent action in the U.S. Dollar (inverted on the chart) and Gold. Majority of the time, negative correlation between the USD and Gold is high. So in plain English, usually but not always, Gold moving up means the U.S. Dollar is moving down, and vice versa. What should grab all of our attention is how powerful the recent USD rally has been and yet Gold has held its own (observe the blue box in Chart 1). Chart 2: Price is compressed in a technical triangle and it’s decision time Source: Short Side of Long The fact that Gold has barely sold off and still remains above $1,200 per ounce, at a similar price where it traded 18 months ago, indicates relative strength and buying interest. Other commodities, such as Crude Oil, have not been as lucky with greenback moving up so high. Eventually the U.S. Dollar rally will pause and take a breather, because nothing can keep rising vertically forever. It is my view that Gold will outperform when that time comes. Now… most trades would like to know when that will happen. Because I do not have a crystal ball, I cannot answer that question like other so-called “experts.” But what I can say is that the current price action in Gold shows a major compression in the form of a technical triangle. This pattern is edging closer and closer to a break in either direction, which should give us further clues (refer to Chart 2). I believe this break will be on the upside and I recently purchased some Gold via the SPDR Gold Trust ETF ( GLD). Depending on how the price behaves, this could either just be a short-term trade or a longer-term investment. Chart 3: Miners have been terrible performers since 2011 and appear cheap Source: Short Side of Long Furthermore, Gold Miners have become extremely oversold and now trade at dirt-cheap valuations. When compared to the Gold price itself, miners trade at the biggest discount since 2000… around the time the last major precious metals bull market started (please see Chart 3). This is even more true when we look at the Market Vectors Junior Gold Miners ETF ( GDXJ), which is down by almost 89% from the highest high in late 2010. I’ve started a small position here to test the waters (similar to Russia and Uranium if you refer to Chart 4). Also worth an important mention, I have closed my major hedge on Silver, which was originally opened in early July of 2014 just above $21 per ounce. This was one of my biggest trades in recent times and a gain of 24.5% is really, really huge. I plan to use these profits to purchase more PMs and average down my previous positions, which sit underwater. Moreover, despite a huge rally in the U.S. Dollar, I will continue to hold all my cash in this currency for the time being. My shorts on the Aussie Dollar also remain in place for now. Finally, the only other position I have opened recently is the Chinese H shares bet, but more on that in another post. Chart 4: Recent additions to the portfolio are PMs and Chinese stocks Source: Short Side of Long Disclosure: Biggest trades in the portfolio are long Precious Metals, long Chinese equities, short Australian Dollar and finally cash held in U.S. Dollar currency. Link to the original article on The Short Side Of Long