Tag Archives: fn-end

Guide To European Hedged ETFs

Apart from the oil price havoc, Europe has taken center stage globally with the start of the New Year thanks to the struggling economy, political instability in Greece and tumbling Euro. This is especially true as fears of the opposition party’s win in Greece later in the month led to apprehensions of the country’s departure from the Eurozone. Europe is struggling with slow growth, tumbling inflation, higher unemployment and deflation fears that have been stalling the burgeoning Euro zone economic recovery for several months. This is especially true as PMI Composite index, for the Euro zone fell to 51.4 in December from the flash estimate of 51.7. However, it is up from the 16-month low of 51.1 in November, suggesting that economic and business activity in the Eurozone is growing but at an anemic pace. In fact, the PMI Composite index grew by just 0.1% in the final quarter of 2014 driven by continued downturn in France and Italy as well as a faltering Germany, a powerful engine and the largest economy of Europe. Additionally, several months of decline in energy prices has finally trapped Eurozone into deflation for the first time in more than five years. Inflation has turned negative with consumer prices falling 0.2% year over year in December. All these sluggish fundamentals have bolstered the case for aggressive quantitative easing (QE) measures by the European Central Bank (ECB) that might be similar to the policies that the U.S. or U.K. undertook over the past few years. The ECB signaled last week that it could announce a major bond-buying program later this month to reinvigorate growth in the continent and fight deflation. If successful, this will propel the European stocks higher but continue to weigh on the currency. The euro tumbled to a nine-year low of $1.18 against the greenback. The downfall can also be credited to the measures taken by the ECB last year when it cut interest rates to record lows and supported the purchase of some private-sector bonds. Further, the strengthening the U.S. economy and the prospect of rising interest rates sometime in mid 2015 are driving the U.S. dollar upward, thereby resulting in depreciation of the euro against the USD. However, a slumping euro will actually benefit exporters and the manufacturing industry, resulting in soaring stock prices. This is because Japan is primarily an export-oriented economy and a weaker currency makes its exports more competitive. It will also help in improving the regions’ trade balances. Given this, investors may still want to play the European space while simultaneously seeking protection against the sliding euro. Fortunately, there are a handful of euro-hedged ETFs available on the market, any of which could be excellent choices in the current environment. Below, we have profiled some of these in detail for those who are looking for a hedged European ETF exposure at this time: WisdomTree Europe Hedged Equity Index Fund ( HEDJ ) This fund offers exposure to the European stocks while at the same time provides hedge against any fall in the euro. This will be done by tracking the WisdomTree Europe Hedged Equity Index. In total, the fund holds 126 securities with a heavy concentration on the top 10 holdings at 45.4%. However, it is pretty well spread across a number of sectors with consumer staples, industrials, consumer discretionary, financials and health care taking double-digit exposure. Among countries, Germany (26%), France (24.5%), Spain (18%) and the Netherlands (16.7%) dominate the holdings list. HEDJ is one of the popular and liquid choices in the European space with AUM of about $5.5 billion and average daily volume of more than 1.2 million shares. Expense ratio came in at 0.58%. The fund is up 0.2% in the trailing one-year period. Deutsche X-trackers MSCI Europe Hedged Equity ETF ( DBEU ) This product tracks the MSCI Europe US Dollar Hedged Index, which provides exposure to the European equity market and hedges the euro to the U.S. dollar. The fund holds 442 securities in its basket, which is widely spread out across each component with none holding more than 2.92% of assets. United Kingdom takes the top spot at 28.5% while Switzerland, France and Germany round off the next three spots. From a sector look, financials account for the largest share at 22.2% closely followed by consumer staples (19.2%). Other sectors make up for a nice mix in the portfolio with a single-digit allocation. The fund has amassed $723.2 million in its asset base while trades in good average daily volume of more than 310,000 shares. It charges 45 bps in fees per year and returned 0.7% over the past one year. iShares Currency Hedged MSCI EMU ETF ( HEZU ) This product provides local currency performance of stocks from developed market countries within the EMU (European Monetary Union) while managing currency risk as well. It follows the MSCI EMU 100% USD Hedged Index and is a play on the popular iShares MSCI EMU ETF ((NYSEARCA: EZU ) with a hedge to strip out the euro currency exposure. The fund holds 248 well-diversified securities in its basket dominated by financials (22.7%) and followed by consumer discretionary (13.2%) and industrials (12.7%). The ETF has amassed $64.2 million in its asset base since its debut in July 2014 and trades in small volumes of 39,000 shares a day. The fund charges 51 bps in annual fees from investors and has delivered flat returns since its debut. Currency hedge strategies are gaining immense popularity in recent months on a strengthening U.S. dollar and the prospect of higher interest rates. Given a weak Euro and hopes of stimulus, investors could definitely look to these currency hedged ETFs. These products are expected to perform better than the traditional funds if ECB introduces a massive asset buying program.
Any Hope For A Gold And Oil ETF Rebound In 2015?

Gold and oil were the two most-talked-about commodities last year thanks to their awful performances. These two widely-followed commodities witnessed dire trading in 2014 with the latter being thrashed heavily by the strength of the greenback, demand-supply imbalances, and cooling geo-political tension in the second half of the year. While muted global inflation, reduced demand from key consuming nations like China and India restricted the yellow metal’s northward ride, the return of worries in the Euro zone, and poor data points from Japan and China have made oil more diluted. As a result, oil prices plummeted more than 50% in 2014 and gold registered the first consecutive annual decline last year since 2000 . Some are also worried that the slump could continue as the Fed is now on its way to hike the key rate this year. The Fed’s step strengthened the dollar and in turn marred commodity investing. Great Start to New Year for Gold Having lost more than 8% in the last six months, SPDR Gold Trust ETF (NYSEARCA: GLD ) bounced back to start the New Year gaining about 2% in the last two trading sessions as of (January 5, 2014). So, did the biggest gold mining fund, Market Vectors Gold Miners ETF (NYSEARCA: GDX ) , which has added about 5.8% during the same phase. Gold miners – which often trade as leveraged plays on gold – delivered two successive years of negative performances losing about 50% in 2013 and 16% in 2014. A sagging stock market and worries over Greece political crisis indicating the nation’s likely way out of the Euro area bolstered the safe-haven appeal of gold to start this year. As a result, gold bullion crossed the $1,200/ounce mark after a few months. In such a situation, investors might want to know the upcoming course of gold related ETFs. We do not expect the latest uptrend to last long. Most of the macroeconomic indicators that went against gold prices last year like the Fed policy, strong U.S. dollar and deflationary spell, will nothing but intensify this year. GLD is trading a little below its 200-day simple moving average but higher than 50 and 9-day simple moving averages which signify long-term bearishness for the ETF. The biggest fund in the space, GLD, is yet to enter the oversold territory as depicted from the above chart. The ETF is trading at a Relative Strength Index (RSI) value of 53.48 indicating there is room for further erosion in the price once the risk-off sentiments drop out of sight. The trend was similar for GDX too with current price trading below long-term averages and above the short-and-medium term averages. Its RSI value stands at 56.54. In a nutshell, miners will likely follow the underlying metal’s direction, obviously with higher magnitude, this year. Overall, the gold mining space will likely see a mixed 2015 and will be busy paring down losses incurred last year. Investors interested to bet on gold should follow the space closely as it is expected to be on a roller coaster ride this year. No New Year Party for Oil Unlike gold, there was no celebration for oil this New Year. WTI crude prices are now below $50, marking a massive slide from their level a year ago. Needless to say, this was a new multi-year low. Persistent supply glut, no production cut by OPEC as well as the U.S. will keep the space under pressure. United States Oil Fund ( USO ) is trading a little below long, medium and short-term moving averages which signifies utter bearishness for the product. In fact, it seems as though oil does not have any driver which can revive it in the near term. However, the product is presently trading at a RSI value of 22.53 indicating that it slipped into oversold territory and might change its course soon after hitting a bottom. Per barrons.com , Citigroup’s commodity group cautioned about a frustrating 2015 for oil and slashed its oil-price forecast for this year and the next to even lower than its most bearish prior estimates. Citi cuts price expectation for WTI crude from $72/barrel to $55 in 2015 while Brent oil price expectation has been reduced to $63 a barrel from $80 a barrel. Bottom Line In short, 2015 should not be great for both commodities and the related ETFs barring some occasional spikes which can be defined as a correction. Investors dying to look for a sustained trend reversal in these commodities, should wait for a big Chinese and Euro zone stimulus, which may bolster the regions’ waning manufacturing industry spurring the usage of oil and goading investors to buy more gold (notably, China is the world’s largest consumer of the yellow metal). Investors should also look out for a pull back in oil production and the return of geo-political tensions. As far as the Fed rate hike is concerned, we believe that the most of it has been priced in at the current level, suggesting that either way, it will be another interesting year for oil and gold.

Relative Rotation Shows U.S. Equities Are The Place To Be

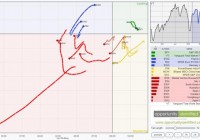
RRG charts help us focus on those areas of the investment universe that deserve it. This article looks at the relative strength of the world’s largest markets, using the total world ETF from Vanguard as our benchmark. If you are looking to invest in stocks, the U.S. is still the best place (at this time) to be. We live in the golden age of investing. Never before have individual investors had so much available to them for gaining investment knowledge, finding great investment opportunities, and the ability to take advantage of them at such a low cost. Our parents could only dream of having investment communities like Seeking Alpha, investment blogs like ours , almost limitless fundamental information online, and technical analysis tools only one click of a mouse (“what’s that?” says your grandpa) away. And with the advent of ETFs, common investors can invest in pretty much whatever and wherever they want. Want to buy timber? Go for it. There’s an ETF for that, the iShares S&P Global Timber & Forestry Index ETF ( WOOD). How about palladium? Got you covered with the ETFS Physical Palladium Shares ETF ( PALL). Want to invest in foreign markets like South Korea? Be my guest, the iShares MSCI South Korea Capped ETF ( EWY). Do you really like coffee? Try the iPath Dow Jones-UBS Coffee ETN ( JO). With sugar? Sure, the Path Dow Jones-UBS Sugar Total Return Sub-Index ETN (NYSEARCA: SGG )! Investors today have the investment world at their fingertips. In this week’s RRG™ analysis, we’re going to look at the relative strength of the world’s largest markets, using the Vanguard Total World Stock ETF (NYSEARCA: VT ) as our benchmark. Basically, we want to see where in the world we should be focusing our attention. Accordingly, the following ETFs representing most of the world’s largest stock markets will be compared against VT: SPDR S&P 500 Trust ETF ( SPY) Vanguard Total Stock Market ETF ( VTI) iShares MSCI Canada ETF ( EWC) iShares MSCI France ETF ( EWQ) iShares MSCI Germany ETF ( EWG) iShares MSCI Italy Capped ETF ( EWI) iShares MSCI Spain Capped ETF ( EWP) SPDR EURO STOXX 50 ETF ( FEZ) PowerShares India Portfolio ETF ( PIN) S PDR S&P China ETF ( GXC) iShares MSCI China ETF ( MCHI) iShares MSCI South Korea Capped ETF ( EWY) iShares MSCI Hong Kong ETF ( EWH) iShares MSCI Japan ETF ( EWJ) iShares MSCI Australia ETF ( EWA) Market Vectors Russia ETF ( RSX) Generally speaking, when looking at the ETFs above in the RRG™ below, those in the green leading quadrant are what you want to own; those within the yellow weakening quadrant should be on your watch-list (as they might be deteriorating), those within the red lagging quadrant should be avoided and those in the blue improving quadrant should be on your shopping list. In the RRG™ below, the long tails represent the movement of each country’s ETF over the past 10 weeks in comparison to the world ETF, VT. So what do we see? The first thing to notice is the chart of VT in the upper right corner. Global stocks as a whole are down since July. Accordingly, when we analyze this chart, we want to be cognizant of the fact that maybe stocks as a whole are not where we want to be. That being said, if we are looking for stock opportunities, we see that we should be in the U.S. (SPY and VTI have been leading the last 10 weeks) and looking for potential opportunities in Germany, France, and Europe as they have moved from lagging to improving over the past 10 weeks. And finally, we should also look to China as they are subtly rotating from weakness towards leading. In conclusion, if we have to be in stocks, we should be in the United States and looking for potential opportunities in Germany, France, Europe, and China. [1] Note: The terms “Relative Rotation Graph” and “RRG” are registered trademarks of RRG Research . (click to enlarge)