Tag Archives: fn-end

Using Adaptive Asset Allocation To Limit Market Risk And Increase Return

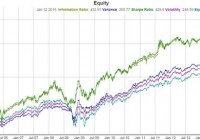
Summary Adaptive asset allocation enables an investor to capture higher returns and reduce risk compared to “buy and hold” and “fixed asset allocation”. Adaptive asset allocation can adjust the portfolio to compensate for varying market conditions. A backtest from Nov 2005 to Jan 2015 shows one allocation strategy resulting in more than double the returns and much less risk compared to a buy and hold strategy. Adaptive asset allocation is often cited as an attractive alternative to fixed or standard asset allocation so popularly used. Standard asset allocation or fixed asset allocation is the idea of allocating 10% of your portfolio to this and 25% to that and another 7% to this asset class and keeping that percentage fixed regardless of market circumstances. Adaptive asset allocation is quite different in how it decides how much is allocated to each asset in a portfolio, instead of using fixed numbers set by an individual or corporation at one time during one market cycle and sticking with it through thick and thin, adaptive asset allocation adjusts or adapts the portfolio weightings on a regular basis based on maximizing or minimizing a certain performance metric such as volatility or variance or even the Sharpe ratio. Market cycles as well as bear markets can be ruinous at worst and challenging at best for most fixed asset allocation models. If you recall 2008, the S&P 500 lost around 55% of it’s value, but Gold didn’t miss a beat until it has lost 1/3 of it’s value from 2011-2013. Bonds surged while the stock market crashed in 2008, but many bonds faltered for much of 2013 while the stock market soared. Certainly you can see why diversifying a portfolio is of great value, but it begs the question “Why did we have to hold on to the stock funds we were invested in?”. The first reason we could cite is a very valid one, and it is because we needed to hold onto it so we could benefit from it in the good years like 2013. The next question you may ask is “Why couldn’t we reduce the amount of money we have in the stock market when it is falling or the bond market when it was falling and why have I been holding so much Gold the last few years?”. This is where a fixed allocation system simply says we set a fixed amount and we stick to it regardless of circumstances, but lets take a look at how adaptive asset allocation answers this question. Enter Adaptive Asset Allocation Adaptive Asset Allocation sets the weight of each asset in your portfolio not by a fixed percentage but as a result of optimizing different performance metrics. For example, we could optimize a portfolio’s weightings to minimize volatility or minimize variance or maximize the risk adjusted return (Sharpe Ratio). Each of these optimization criterion can be used to decide how much of each asset in your portfolio instead of using a fixed percentage. As you can see, adaptive asset allocation answers the questions posed above, namely how can we reduce the allocation in a certain asset when it is doing poorly. We are now going to reduce our assets in an asset that is volatile or has a high variance or a low risk adjust return (Sharpe Ratio), and increase our assets in funds that have low volatility or low variance or a high risk adjusted return. Our Test Now that we have established the rationale for why we might want to use adaptive asset allocation let’s test a sample portfolio to see if Adaptive Asset Allocation can improve returns and reduce drawdown. For this portfolio I am going to use Exchange Trade Funds (ETFs) to select US Stocks, International Stocks, Gold, and US Treasury bonds as our portfolio assets. The tickers used are SPY for US Stocks, EFA for International Stocks, GLD for Gold, and TLT for US Treasury bonds. Parameters We are going to try 3 different performance metrics for deciding our weighting, the first is minimizing volatility, the second is minimizing variance, and the third is maximizing the risk adjusted return (Sharpe Ratio). For all calculations we are just going to use the 3 month trailing volatility, variance, and Sharpe ratio as our measurement. We are going to adjust the portfolio on a monthly basis, this may be too often or not often enough, but for an introduction to these type of ideas it is what we will use. Results – Volatility (click to enlarge) Pink Line is Volatility Returns (click to enlarge) Weightings for each symbol over time (EFA=yellow, GLD=blue, SPY=green, TLT=pink) The performance for the minimum volatility weighted portfolio is: 9.42% CAGR 0.98 Sharpe Ratio 9.72% Volatility 22% maximum draw down This compares to the equally weighted version of this portfolio (25% SPY, 25% GLD, 25% EFA, 25% TLT): 8.5% CAGR 0.76 Sharpe Ratio 11.61% Volatility 28.81% maximum draw down And to the S&P 500 alone: 7.64% CAGR 0.47 Sharpe Ratio 19.96% Volatility 55.22% maximum draw down The minimum volatility adaptive asset allocation portfolio successful outperformed the S&P 500, and equally weighted portfolio in all the performance metrics shown above! As you will see in the transition map image above, the volatility adaptive asset allocation did a lot of what we mentioned to reduce risk; during the 2008 stock market crash the % in SPY and EFA dropped considerably, while the bond fund took over a large percentage of the portfolio, and recently the allocation in gold has been dropping to reduce the exposure to the falling gold market. Results – Variance (click to enlarge) Blue Line is Variance Returns (click to enlarge) Weightings for each symbol over time (EFA=yellow, GLD=blue, SPY=green, TLT=pink) The performance for the minimum variance weighted portfolio is: 10.1% CAGR 1.12 Sharpe Ratio 8.95% Volatility 14.84% maximum draw down The minimum variance adaptive asset allocation portfolio again successful outperformed the S&P 500, and equally weighted portfolio in all the performance metrics shown above! The minimum variance adaptive asset allocation did even more than the minimum volatility portfolio to reduce risk and increase returns. During the 2008 stock market crash the % in SPY and EFA dropped to near 0%, while the bond fund took over the majority of the portfolio, the allocation in bonds dropped while stocks recovered, and recently the allocation in gold has been dropping to near 0% to reduce the exposure to the falling gold market. Results – Risk Adjusted Return (Sharpe Ratio) (click to enlarge) Green Line is Sharpe Ratio Returns (click to enlarge) Weightings for each symbol over time (EFA=yellow, GLD=blue, SPY=green, TLT=pink) The performance for the maximum Risk Adjusted Return (Sharpe Ratio) weighted portfolio is: 15.43% CAGR 1.07 Sharpe Ratio 14.4% Volatility 27.27% maximum draw down The maximum Sharpe ratio adaptive asset allocation portfolio again successful outperformed the S&P 500, and equally weighted portfolio in all the performance metrics shown above – especially returns! The maximum Sharpe Ratio adaptive asset allocation did a lot to increase returns and even managed to outperform in the areas of drawdown and volatility over the S&P 500 and equal weight portfolios. Optimizing the Sharpe ratio is definitely aggressive, you will notice how it often completely eliminates assets from the portfolio and even is only in a single asset during certain times. During the 2008 stock market crash the % in SPY and EFA dropped to 0%, while the bond fund took the entire 100% of the portfolio, the allocation in bonds dropped while stocks recovered and there were many times when stocks where 100% of the portfolio, and recently gold has been almost completely absent from the portfolio even though it played a strong role in the portfolio when it was surging upwards earlier in the backtest. One More Thing… One thing that may be problematic is the fact that some of these allocations involve entirely or nearly getting rid of an investment, especially the Sharpe Ratio portfolio. One thing we can do to combat this is what I call “dampen” the weighting algorithms. This involves “dampening” the effects of each weighting algorithm by only allowing the weighting algorithm to go so far. For example you could decide you want to hold no less than 5% of a certain asset, you could then call 0-4% 5% and adjust the other weightings accordingly to effectively “dampen” the effect of the weighting algorithm to make the portfolio more like a fixed allocation strategy. So lets take a quick look at “dampening” the Sharpe Ratio adaptive asset allocation portfolio to see what a little more conservative switching can do: Results – Risk Adjusted Return (Sharpe Ratio) with ~7% Minimum per Asset (click to enlarge) Green Line is Sharpe Ratio with Dampening Applied (click to enlarge) Weightings for each symbol over time (EFA=yellow, GLD=blue, SPY=green, TLT=pink) The performance for the maximum Risk Adjusted Return (Sharpe Ratio) weighted portfolio with dampening is: 13.68% CAGR 1.13 Sharpe Ratio 12.04% Volatility 24.68% maximum draw down So we reduced the full effect of the Sharpe Ratio weighting and we got a portfolio that did not entirely eliminate any symbol, but also wasn’t afraid to aggressively reduce its allocation in assets when they had a bad risk adjusted return value. The results show a smaller CAGR return %, but improvements in the area of Sharpe Ratio, volatility, and maximum drawdown. Conclusion Adaptive asset allocation can be used to re-weight our portfolio to reduce drawdown and increase returns in the ever changing markets as opposed to a more traditional fixed asset allocation. We tested 3 techniques that can be used to weighted a portfolio and noticed how each responded to the changes in the stock markets, bond markets, and gold market. Each strategy was able to outperform a standard buy and hold approach and the stock market, while also delivering better volatility and draw down numbers in the backtests presented above. With ever increasing uncertainty in the direction of the markets and how best to diversify a portfolio adaptive asset allocation may be one answer of how to eliminate guesswork and provide a foundation for adjusting allocations to compensate for the winds and waves of the markets.
Why I’m Not Closing My Position In Columbia Seligman Premium Tech Fund

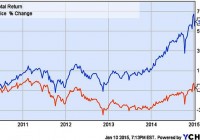
Summary I first noted STK in autumn 2013 when it had a -7.6% discount and a tax-advantaged 12.8% distribution yield. In the time since STK has had excellent performance. It’s moved from discount to premium valuation with a decrease in distribution yield. Is it time to sell? The fund is among the best of the option-income, closed-end funds and remains, in my view, a solid holding. An Update on Columbia Seligman Premium Tech Fund I first opened a position in Columbia Seligman Premium Tech Fund (NYSE: STK ) in September 2013 and wrote about it here in October 2013 . At the time the fund was moving up after mediocre performances in 2011 and 2012. It was paying a 12.8% distribution yield and sported a -7.6% discount. Four months later, after a rough patch at the year’s end, I followed up with a second look at the fund . By that time both discount and yield had given up a bit, and I suggested that the fund was ready to move up. The first chart, which shows market price and total return for the fund’s life, illustrates what happened next. As we see, at the end of 2013 STK began a sharp move up on a market price basis, earning back a good chunk of its losses from the previous years. More telling is the upswing for its total return: Remember it started the year with a distribution yield close to 13%, so distributions added nicely to the already-respectable market-price gain. (click to enlarge) Figure 1 . Market price and total return of STK for the life of the fund. Next. Let’s look at a chart showing the fund’s premium/discount status, especially looking at moves since the time of those articles. I put this at the beginning because it’s important to consider these dynamics in evaluating one’s present position in STK. (click to enlarge) Figure 2 . STK Premium/Discount History. (Source: cefconnect.com ) Note that discount has turned into a premium over the year since I last looked at STK. Premium territory is not a place STK is accustomed to finding itself as Fig. 2 shows, so I’ve begun to ask if it’s time to exit this position. I’m not alone it seems, as I have had inquiries from several readers asking my opinion on holding the fund. Before answering that question (ok, the title is a spoiler, but bear with me) let’s look the fund and how it has performed since I first brought it to your attention. The Fund STK is an unleveraged, technology, closed-end fund with an inception date of 25 November 2009. Its investment objective is to produce income and capital appreciation using a covered-call options strategy in the technology sector, a sector that lends itself especially well to that strategy. The fund maintains a managed distribution policy based on returning a 9.25% rate for IPO investors. In accord with that policy, it has paid $0.4625 quarterly since its inception. The top holdings (from cefconnect.com) are not much different from what they were a year ago: Figure 3 . STK top ten holdings. (Source: Fund Website ) One of the things that attracted me to STK in the first place was the tax status for its distributions. While generating tax-advantaged distributions is not an explicit priority for the fund, managers appear to be factoring this into their decision-making. When it first came to my attention, a large portion of its distribution was return of capital, which is tax-deferred until the fund is sold. I noted last February that I considered this run of RoC likely to end, and that prediction proved correct. May’s quarterly distribution had only $0.06 RoC and the following two quarters had none. The bulk of those distributions have been long-term capital gains, so the distributions remain attractively positioned from a tax perspective. It is sufficiently tax-advantaged (after-tax yield is better than 8.5%) as to be competitive with highly leveraged, long-duration, high-yield, tax-free, muni-bond closed-end funds on an after-tax basis for all but those in the highest marginal brackets. Performance In the next set of charts I’m going to look at performance since I first noted the fund on Seeking Alpha a few weeks after my first purchase. Let’s begin with performance of market and NAV prices. (click to enlarge) Figure 4 . Market and NAV (MUTF: XSTKX ) price performance from October 2013. The market value of STK is up about 30% in this time. Note, however, that NAV has grown only 12%. This differential illustrates one effect of the expansion of the discount to premium valuation the fund has seen over the time course indicated. How does that compare to the fund’s peers. I’ve chosen the NASDAQ index fund, PowerShares QQQ Trust (NASDAQ: QQQ ), and the Technology Select Sector SPDR (NYSEARCA: XLK ) as representative peers. Fig. 5 shows comparisons for price performance. The yellow-brown line is NAV value of STK (ticker XSTKX). (click to enlarge) Figure 5 . Market and NAV price performance for STK compared with QQQ and XLK from October 2013 through 9 Jan 2015. The market price has kept pace with both QQQ and XLK. There is a marked lagging of the peers at the end of 2013, but at today’s market the funds’ performances are essentially identical for the full time frame. Both of these charts track price performance. But, in addition to its gain in price, STK pays that hefty distribution. The yield percentage varied from 12.8% in October 2013 to 10.2% at today’s market price. If we factor those distributions into the results, a quite different picture emerges. The colors make it hard to sort QQQ and XLK; QQQ is the 34.65% line and XLK is the 31.72% line. (click to enlarge) Figure 6 . Total return from October 2013 for STK (market), QQQ, XLK. As we see, STK has been a standout for the time under consideration. One would have to look long and hard to find another technology fund that turned in as impressive a performance for these 15 months. After that stutter-step at the close of 2013 — a year-end dip that is all-too-common for closed-end funds — STK took off and continued to climb with only a brief timeout for the fall mini-correction. Note, too, that unlike last year’s situation, STK closed 2014 with a surge. Clearly, no one was taking year-end tax losses from STK in 2014, although some may have been taking profits after the new year. Outlook for 2015 An interesting aside here is that when I reiterated my confidence in STK in Feb 2014, I did so in the context of considering an uncertain market ahead for the year. I liked the prospects for technology, but I also felt that 2014 was certainly not set to repeat 2013, so I was looking for something a bit more defensive. Option-income funds are widely considered appropriate for such conditions, and I was loading up on option-income CEFs at the change of last year. In many ways, I feel similarly about 2015. I’m not one for making predictions, but I will say that I consider that it’s going to be a bit of a bumpy ride: Once again, conditions that favor option-income strategies over, say, leveraged equity CEFs. From that perspective STK looks like a solid hold. On the other hand, I’m well aware that a fair portion of STK’s 2014 outperformance is attributable to the disappearance of its discount and the expanding premium. Z-scores for 3 mo, 6 mo, and 1 yr are 1.17, 1.74 and 1.96, respectively. This puts numbers on what we see qualitatively in Fig. 1 above: STK’s P/D valuations are well above its means for this metric, nearly two standard deviations ahead for the year. Taking the 6 mo Z-score for a reference, that 1.74 value indicates a valuation that would be expected only about 4% of the time for a normally distributed population. However, a close look at Fig. 2 shows that STK’s premium discount is anything but normally distributed over the recent past. If one considers reversion to the mean to be an important driver in CEF premium/discount status, that could lead to a prediction of a decline in the premium in the coming months. The temptation then is to grab the gain created by the current 6.2% premium and move on. One problem is replacing the income. A distribution yield of 10.2% coupled with a recent history of impressive capital appreciation does not come easily. Several option-income funds gave up some ground at the end of the year (see Stanford Chemist’s thoughts on this subject), so there are possibilities, but few that will return that 10%+ and none with a year like STK’s to boost one’s confidence. The list of candidates that do yield 10%+ yields focus on global equity, a category that I’m inclined to skip at this time. For anyone less averse to increasing global exposure, the list includes Alianz GI NFJ Div Inter & Prem (NYSE: NFJ ), Eaton Vance Global Buy-Write Opps (NYSE: ETW ) (55% USA), and Eaton Vance Tax-Managed Global Fund (NYSE: EXG ). All have distribution yields greater than 10%. Another is Voya Global Advantage and Premium (NYSE: IGA ) which has 40% foreign exposure and weighs in with a yield that’s just a squeak short of 10%. But of the four only IGA was in the green for 2014 and none approached the performance of STK. I’m not looking for 2015 to be a better year for global funds than 2014. I’m much more inclined to look to tech for outperformance again this year. (click to enlarge) Figure 7 . 2014 performance of STK and some comparable global-equity option-income funds. What about the pure domestic-front funds? Eaton Vance Tax-Managed Buy-Write Opps (NYSE: ETV ) is a long-time favorite of mine. It, too, saw a run up of its perennial discount into premium territory. It is now back to a modest discount, is paying 9.3%, and may be ripe for entry. Its sibling fund, Eaton Vance Tax-Managed Dividend Equity (NYSE: ETY ), with a -8.14% discount and 9.0% distribution yield, is another prospect. However, even keeping in mind the lack of predictive value in past performances, the 2014 comparison of these funds with STK is worth pondering. (click to enlarge) Figure 8 . 2014 performance of STK and some comparable domestic-equity option-income funds. I see no good reason to anticipate a change in direction relative to STK by either at this time. Discount/Premium It does seem unlikely that STK will sustain the excellent performance of 2014 going into the near future. The premium valuation is not familiar territory for the fund and one has to wonder how stable that premium will be. But let me argue in favor of the fund retaining a modest premium, or at least not sinking back into a deep discount. This thesis is based on STK’s exceptional distribution yield, which is fixed and stable at its current level. When the fund was underperforming on NAV the yield percentage on NAV increased as the discount grew. But NAV performance has turned around and is only an impediment to investors who place high value on several-years’ old performance records (from comments I’ve received on CEFs, I realize that some do, but I’m not among them). I submit no one should be bearish on STK as long as it is keeping pace with its bogies. Furthermore, with the managed pay-out as high as it is, the NAV is less likely to climb sufficiently to lead to a much decreased yield percentage (notice how flat the NAV price line is in Fig. 4). This matters because CEF investors are primarily attracted to the space for income. There is a clear tendency by investors to price closed-end funds with regard to their market yield (sometimes to a point that investors’ logic becomes difficult to comprehend). Thus as long as NAV performance is reasonable, we should expect the market to continue to price the fund at a level that pays something not far from that 10%. Case in point: When it was paying 12-13% it attracted investors sufficiently to drive it to a premium and take the yield down to near 10%. I would argue that we’re now at equilibrium: as long as the yield percentage does not move much away from that 10%, the premium will not move much either. Thus, with the payout fixed, and no real reason to anticipate a run up of NAV that overwhelms a run up in market price and reduces the yield percentage, I would expect a fairly stable discount/premium at or near its present level. It will wander, of course, but I’m guessing we’ll not see a sharp change unless there is a problem with distribution yield. If it starts to slip, the discount/premium will go down; if it goes up, D/P will rise. Summary STK has been the star performer of the option-income category of closed-end funds. It continues to pay a tax-advantaged distribution in excess of 10%. Nothing at that distribution yield level even comes close to the overall performance of the fund over the past 15 months. Although it currently has a premium valuation, there’s a solid argument for its retaining that valuation for at least the near-term future. More importantly, I do not see an appealing alternative at this time. None of the funds that provide equivalent (and equivalently tax-advantaged) income show any indication that they are set to outperform STK significantly going forward. I think this fact helps contribute to the premium STK now holds. I am, therefore, holding my position in STK. The question for many readers will not be whether or not to hold the fund, but is it a buy?I am currently shopping this space and the only thing that might keep me away from buying more is the premium. I’m generally reluctant to buy any closed-end fund at a premium. In this case I could make an exception, for the reasons I outlined above. If, however, there is some movement away from the current premium, I would be strongly inclined to add to my position. As always, I note that I have no professional expertise on finance or taxation issues. I’m a self-schooled individual investor passing on the results of my research. I make mistakes. My situation is mine alone, and my research if focused on my portfolio and my investing priorities. Anyone who is intrigued by or finds value in my thoughts will certainly want to do his or her own due diligence to determine if my conclusions are appropriate for their unique situations.

Start Living An Easier Life And Start Beating The Market Through Contrarian ETF Investments

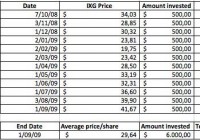
Summary Periodically buying the SPY all the time might be too boring for some people. Mixing things up with this new strategy might be more their cup of tea. As an example, John, our imaginary investor, will be using this new technique during the Financial Crisis of 2009 and during the GREXIT fears of 2012. With this new strategy, John doubled his performance. He gained 40% during 2008 – 2009 instead of 20%, and 22% during 2012 instead of 11%. So why even pick stocks if you can pick ETFs? It’s safer, easier and you’ll be able to beat the market. Discover 3 very interesting opportunities in the market right now, that might also lead to above average results. John might be getting a first position right now. In my previous article , we learned that life could be much easier and that perhaps joining them instead of trying to beat them might be the better option. However, in today’s article, I’ll dig deeper and see if simple investors like John can actually beat the market – by doing just one thing differently. Yes, there’s a way to still beat the market. And today, we’ll back-test that way 2 times + I’ll give you three possible opportunities that might lead to those same market-beating results. The portfolio strategy I’m going to describe to you during this article is all about two words: ‘Contrarian’ and ‘ETFs.’ It’s the Contrarian ETF Strategy. Let’s break down those words. A contrarian: A person who takes a contrary position or attitude; specifically: an investor who buys shares of stock when most others are selling and sells when others are buying. An ETF: A security that tracks an index, a commodity or a basket of assets like an index fund, but trades like a stock on an exchange. So the strategy goes as followed: Instead of picking individual shares of a company that is in trouble – which continues to be the more risky way of being a contrarian – we now decide to periodically buy an ETF related to an industry/commodity or country that is in trouble. You see, each year, there seems to be some sort of crisis going on somewhere in the world. Often does everyone think the world will end (for that particular industry that is in trouble) but in 99% of these cases, the world doesn’t end and these industries find ways to survive. Crises often are opportunities – when played right – and I bet you’re feeling the same thing. Are oil companies offering the opportunity of a lifetime right now? And how about oil suppliers and companies delivering services to oil companies? And what about Russia? Is Russia an opportunity or a value trap? Will the Ukraine – Russia war really last forever? Will oil remain below $100 during the next 10 years? Will Greece leave the EU? Well, I don’t know all the answers, but I do know that I’m very inclined to say “NO” to all of these questions. People love drama. And we all love doom-scenarios. But how often did any of them played out? Also, when you really think about it: Does oil really have to be at $100 before you – as an investor – can make a profit of certain oil related stocks? Hell no. Certain stocks would jump 20% if oil would make a 5% recovery, or would show signs of a simple stabilization. Does Russia really have to report a 2% GDP growth figure before you, as an investor, can make a decent profit? Hell no. Anything positive, anything that gives investors the outlook that “things will get normal again” will make Russian stocks go nuts (hence the 10% bounce in 4 days time that occurred last week). However, while most investors recognize these opportunities and see the possible value in these areas of the market right now, they often see things too pessimistic and are too uncertain. “I don’t know anything about Russian or Greek stocks. I know nothing about oil companies or their suppliers, I don’t know which ones are the good ones.” Well you don’t have to know which ones the good ones are. That’s what ETFs are for. John’s strategy during the financial crisis of 2009. Remember John from my previous article? Well, he’s back in town. John is still buying the SPDR S&P 500 Trust ETF (NYSEARCA: SPY ) each month, and just like he was in my previous article, he still is a pretty smart guy that loves to seize opportunities whenever they come along. Last time, he decided to double his investment efforts during the financial crisis. Instead of buying $500/month during 2009, he decided to buy $1000/month. This time, he’s about to do something even more smart. John figures that the industry that is being hurt most, will also have most upward potential. But instead of picking individual stocks and making risky/uncertain decisions that will make him sleep bad at night, he decides that now is the time to buy a financially related ETF. The iShares Global Financial ETF (NYSEARCA: IXG ) seems to be perfect, as it covers 240 banks. This way, he tries to profit – like a real contrarian – from an industry that is in serious trouble while not exposing himself to too much risk. John puts his monthly investments in the SPY on halt and puts his $500 in the IXG instead. However, like we mentioned, John is a very, very smart guy and he knows that a crash can go on for a long time, and thus that chances are real that he gets in too early. Therefore he has one rule when it comes to his contrarian plays: He will only get a first position after a 40% drop. On October 7, 2008, John finally gets what he wants. The IXG fell 40%. From $58 to $34, and John decides to make a first purchase. He then adds to this position the first of each of the following 11 months. After eleven months, and after investing his 6k, John possesses: 202 shares at an average price of $29.64. Which is far below his original entrance point. Thank god he didn’t went all in at once and stayed with the $500/month rule. (click to enlarge) With this strategy, John scored a ~40% return while not having to time the market, not having to take individual risky picks and while keeping it simple. If he had invested in the S&P 500 through the SPY this whole time, then he had gained 19%. So he doubled his return by making a simple shift in where he puts his assets. Of course, this is just one example where dollar cost averaging on an ETF of a sector in trouble turned out very nicely compared to the regular SPY and this is not a representation of any future scenario. So in order to make this theory a little more valid, let’s take a look at a second example. Same strategy, different scenario During the European Debt Crisis in 2012; everyone thought that Greece would be leaving the Eurozone and that the country would be doomed. On May 16, its main index (the ATHEX), had lost more than 40% compared to its year high in Feb., and was now quoting at 209 points. John didn’t belief that Greece would have to leave the Eurozone (damaging only itself and other members of Europe) and thus he decided to expose himself to the country as a whole. He again stops purchasing the SPY – and decides to buy the Global X FTSE Greece 20 ETF (NYSEARCA: GREK ) with his $500/month. After 11 months of dollar cost averaging, John held 625 shares of GREK at an average price of $14.12 while the index was now above $17. John was able to gain a nice 22% in a relatively safe way, while knowing nothing about Greek stocks. At a certain point, he was sitting on a 40% profit. More interesting though, is that John would have only gained 11% if he had continued to buy the SPY during the same period. So yet again John doubled his return. Conclusion Although periodically investing in the SPY should give one decent returns over time, it seems very likely that whenever a sector/industry/country appears to be in trouble, it might be a wise thing to shift your deposits from the SPY into an ETF related to this industry for the course of a year – after they’ve dropped ~40%. This could lead to market-beating results without much effort and without too much risk. Today, I’m seeing 3 great contrarian plays that fit John’s new strategy: Greece Greece is yet again being confronted with a “Grexit” and the ATHEX dropped more than -44% since January 2014. John would be getting his first position now, and this could lead to above average returns within a year from now. As Aristofanis explains here , a Grexit is very unlikely, just like last time. Russia The Russian index has fallen -48% since January 2014 and is also offering a high risk/reward. A first position of $500 now, could lead to market-beating results within a year from now, if you continue to dollar-cost average on the Market Vectors Russia ETF (NYSEARCA: RSX ) the following months. The fact that you’ll be dollar cost averaging + that you’re buying not a few specific Russian companies, is definitely lowering your overall risk. The Russian – Ukraine conflict can’t go on forever and the sanctions that Europe imposed on Russia could be relieved sooner than expected. Russia is in real trouble, now that the rouble and oil prices dropped so much: It’ll simply have no other choice than to retreat and to improve the situation with the Ukraine in order to save its economy. Oil Oil prices have taken a steep dive and thus it might be more than interesting to consider a position in the SPDR Oil & Gas Exploration & Production ETF (NYSEARCA: XOP ), as it is down more than -45% since its all-time-high of mid last year and holds ~83 holdings. However, further downside is definitely possible as oil hasn’t found its bottom yet. By Q3 of 2015 or early 2016 however, I belief that oil prices will start a sharp recovery. The commonly held belief is that Saudi Arabia is keeping prices so low by not lowering its production to put a stop to the rapid growth of production from the U.S. shale oil plays. Others believe it is their goal to crush the Russian and Iranian economies. If the oil price remains at the current level for a few months longer it will do all of the above and then it has succeeded. Also don’t forget that the low oil price will lead to an increased demand from all major economies who are thrilled to get themselves some cheap oil, if they all do this at the same time, there’s a possible shortage imbound which could lead to much higher prices in a short period of time. Mark Mobius, an economist and regular guest on Bloomberg TV recently said he sees Brent rebounding to $90/bbl by the end of 2015 and I agree with this vision. Although $70/bbl would also be good enough in order to make a profit of this ETF. Main source used for my oil prospects: Here . Read the full article, it is really interesting. Additional disclosure: All figures are coming from Yahoo Finance: I used ADJUSTED figures for dividends and splits for simplicity purposes. Returns are supposed to be accurate though.