Tag Archives: fn-end

The 5 Funds – Q4 2014 Portfolio Review

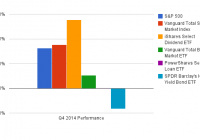
Summary Reviews the performance of The 5 Funds Portfolios. The Vanguard REIT Index was the top performing ETF in the portfolios last quarter. Junk Bonds and International ETFs were the worst performers. Each quarter I plan to update my 3 portfolios: The Aggressive 5, The Moderate 5, and The Conservative 5 and show the performance from the previous quarter, as well as since inception. I’ll also give an update on why I’m making some of the changes and my quick market update. Hopefully this will be helpful for people either following my portfolios or creating their own ETF portfolio. The Conservative 5 Name Symbol Type Allocation Change Vanguard Total Stock Market Index ETF (NYSEARCA: VTI ) Large Cap Blend 25% +5% 1 iShares Select Dividend ETF (NYSEARCA: DVY ) Mid-Cap Value 16% +1% 3 Vanguard Total Bond Market ETF (NYSEARCA: BND ) Intermediate Term Bond Fund 35% None PowerShares Senior Loan ETF (NYSEARCA: BKLN ) Short Term Bond Fund 0% -10% 2 SPDR Barclay’s High Yield Bond ETF (NYSEARCA: JNK ) High Yield Bond Fund 9% -1% 3 iShares Floating Rate Bond (NYSEARCA: FLOT ) Short Term Bond Fund 10% +10% 1 Cash Cash 5% -5% 2 Updated 1/4/2015 Add Allocation Reduce Allocation Investment Drift (No New Trades Required) Conservative 5 Performance* Conservative 5 SPY (S&P 500) Last Month -0.6% -0.3% QTD 2.0% 4.9% YTD – – Since Inception (10/1/2014) 2.0% 4.9% Std Dev. compared to SPY .31 1.0 As of 12/31/2014 Performance by ETF January 2015 Update The biggest update to the Conservative 5 Portfolio ​is the removal of PowerShares Senior Loan ETF and replacing it with the iShares Floating Rate Bond. The reason for the change is that I’m concerned with the amount of volatility in BKLN. As we saw, it took a few large dips in the 4th quarter of 2014. BKLN consists of a lot of lower quality bonds which is the reason for the volatility, FLOT is a more conservative, less volatile ETF which allows us to increase our position in VTI without adding much additional volatility to the portfolio. We continue to favor equities over bonds in 2015 and feel as rates rise and bonds are hurt, the equity market should outperform. We have also reduced the cash position in the account to 5% and moved that money over to Vanguard Total Stock Market Index. This move will add slightly more risk to the portfolio, but the overall risk of the portfolio should not be increasing significantly. The Moderate 5 Name Symbol Type Allocation Change Vanguard Total Stock Market Index ETF VTI Large Cap Blend 60% +5% 1 Vanguard FTSE Developed Markets ETF (NYSEARCA: VEA ) Large Cap International 5% -5% 2 Vanguard FTSE Emerging Markets ETF (NYSEARCA: VWO ) Emerging Markets 0% -5% 2 Vanguard Total Bond Market ETF BND Intermediate Bond 20% None Vanguard REIT ETF (NYSEARCA: VNQ ) REIT 5% None PowerShares QQQ ETF (NASDAQ: QQQ ) Large Cap Growth 5% +5% 1 Cash Cash 5% None Updated 1/4/2015 Add Allocation Reduce Allocation Investment Drift (No New Trades Required) Moderate 5 Performance* Moderate 5 SPY (S&P 500) Last Month -1.1% -0.3% QTD 3.3% 4.90 YTD – – Since Inception 3.3% 4.9% Std. Dev compared to SPY .63 1.0 ​ As of 12/31/2014 Performance by ETF January 2015 Update We made 2 fairly large updates to The Moderate 5 portfolio during this reallocation, both of which focused on reducing our international exposure and increasing U.S. exposure. We have seen emerging markets really struggle lately because of the rising dollar and many EM countries, like Russia, are oil exporters, so the lower oil prices have weighed on their economy. We have replaced our Emerging Markets ETF with QQQ, which is a technology themed U.S. growth ETF. We believe that the tech sector will continue to grow in 2015 and this should be a good compliment to the Vanguard Total Stock Market ETF already in the portfolio. We also reduced the Vanguard FTSE Developed Markets ETF because we are still concerned with international exposure and would prefer to have that money in the U.S. for now. That being said, we are keeping a close eye on Europe and Japan as we think both could do well this year. Don’t be surprised if we add back to our international position later in the year as Europe, Japan, and even China have promised to keep interest rates low and money pumping into these economies as the U.S. looks to rise rates as QE is now completed. The Aggressive 5 Name Symbol Type Allocation Change Vanguard Total Stock Market Index ETF VTI Large Cap Blend 66% +1% 3 Vanguard FTSE Developed Markets ETF VEA Large Cap International 9% -1% 3 Vanguard FTSE Emerging Markets ETF VWO Emerging Markets 0% -5% 2 PowerShares QQQ ETF QQQ Large Cap Growth 10% None Vanguard REIT ETF VNQ REIT 5% None iShares Russell 2000 (NYSEARCA: IWM ) Small Cap Blend 5% +5% 1 Cash Cash 5% None Updated 1/4/2015 Add Allocation Reduce Allocation Investment Drift (No New Trades Required) Aggressive 5 Performance* Aggressive 5 SPY (S&P 500) Last Month -1.3% -0.3% QTD 4.2% 4.9% YTD – – Since Inception (10/1/2014) 4.2% 4.9% Std. Dev compared to SPY .92 1.0 Performance by ETF January 2015 Update Only 1 large change this quarter to The Aggressive 5 Portfolio which focuses on reducing our international exposure and increasing U.S. exposure. We have seen emerging markets really struggle lately because of the rising dollar and many EM countries, like Russia, are oil exporters, so the lower oil prices have weighed on their economy. We have replaced our Emerging Markets ETF with iShares Russell 2000 Index. We saw small cap companies struggle in 2014 and think that they could rebound in 2015 now that their valuations are more attractive than where they were a year ago. We believe 2015 will be a good year for the market and typically small company stocks outperform the S&P 500 in that type of environment. We didn’t make a change to the Vanguard FTSE Developed Markets ETF, but the allocation percentage dipped by 1% because of their under performance over the past quarter. As discussed above, we are keeping a close eye on Europe, Japan, and even China, as we think these economies could do well this year. *Performance is measure by Morningstar and assumes no trade commissions. Assumes trades were placed on 10/1/14 at the closing price on that day.
Lipper Closed-End Funds Summary: December 2014

By Tom Roseen In December the U.S. market took investors on a wild ride. Toward month-end the Dow Jones Industrial Average and the S&P 500 Index posted their thirty-eighth and fifty-second record closes for the year, respectively. A strong nonfarm payroll report at the beginning of the month pushed up U.S. equity markets, and the Dow flirted with the 18,000 mark for the first time. However, concerns about the health of the global economy the following week fueled one of the largest one-week drops in two and half years and sent the VIX to its highest level since October 17. Investors shrugged off a better-than-expected consumer sentiment report and focused on volatility in oil prices and the possibility of the global economy succumbing to deflation. Despite a Federal Reserve-fueled Santa Claus rally toward month-end, U.S. stocks finished the good year on a down note, with the Dow witnessing a triple-digit loss on the last trading day of the month. Both equity and fixed income CEFs posted negative NAV-based returns (-1.43% and -0.24% on average, respectively) for the first month in three, while market-based returns were also in the red for both equity CEFs (-2.51%) and fixed income CEFs (-0.02%). Treasury yields declined at all maturities ten-years or greater in December, with the twenty-year yield declining the most, 15 bps to 2.47% at month-end. The rising dollar and slowing growth overseas made U.S. Treasuries more attractive to foreign investors. The Treasury yield curve rose in most of the lower-dated maturities, with the three-year rising the most-22 bps to 1.10%-by month-end. The one-month yield witnessed a small decline, dropping 1 bp to 0.03%. For December the dollar once again gained against the euro (+2.69%), the pound (+0.32%), and the yen (+0.88%). Commodities prices were mixed, with near-month gold prices rising 0.73% to close the month at $1,184.10/ounce. Meanwhile, front-month crude oil prices plunged a whopping 19.60% to close the month at $53.27/barrel. That equated to a quarterly decline of 40.41% and a one-year decline of 45.87%. For the month 47% of all CEFs posted NAV-basis returns in the black, with 33% of equity CEFs and 58% of fixed income CEFs chalking up returns in the plus column. The slide in oil prices and concerns over Greece’s inability to elect a favored presidential candidate, rekindling fears of another European crisis, weighed on Lipper’s World Equity CEFs macro-classification (-2.43%), pushing it to the bottom of the equity CEF universe. On the equity side (for the fourth consecutive month) mixed-asset CEFs (-0.73%) mitigated losses better than the other macro-groups, followed by domestic equity CEFs (-1.15%). Once again, the municipal bond CEFs group (+1.13%) was the only fixed income macro-classification posting a return on the plus-side for the month, with all of its classifications experiencing returns in the black. The muni CEFs group was followed by domestic taxable bond CEFs (-1.47%) and world bond CEFs (-4.17%). For December the median discount of all CEFs widened just 19 bps to 9.28%-deeper than the 12-month moving average discount (8.55%). Equity CEFs’ median discount widened 115 bps to 9.46%, while fixed income CEFs’ median discount narrowed 53 bps to 9.13%. To read the complete Month in Closed-End Funds: December 2014 FundMarket Insight Report, which includes the month’s closed-end fund corporate events, please click here .

Maybe You Should Be In 100% Cash

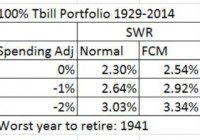
This post has nothing to do with asset prices, valuation, or timing the market as the title may have led you to believe. It has to do with investor psychology and behavior. Over the years I’ve wondered if certain types of people would be happier if they didn’t invest in anything but cash. Not ‘better off’ mind you just happier and still able to meet their financial goals – like a successful happy retirement. Then I said, “I have the data for that analysis.” Let’s take a look at the kind of people I’m talking about. You’ll probably see a bit of yourself in my description. Then let’s see what kind of retirement such a person could reasonably expect and some strategies to make it better. I think we all know the type of person I’m alluding to. Most investors have some of these traits. Constantly worried about any kind of investment. Stocks – they’re always too expensive or so cheap it’s an indication of some forthcoming dire event and thus they must continue to go down. International stocks – same thing, even worse. Bonds – even the mighty U.S. government is going default for sure. Any day now. Gold – sure, we gotta have a lot of that but I need to check the prices three times a day. And anytime prices go down it’s manipulation. Inflation – we’re constantly falling behind in standard of living. At the extreme, always worried about large inflation any day now. Yield – the need to reach for yield and check news every day that may affect the income stream. Price fluctuations of any significant amount are a sign to take action and seek refuge. Logging in to investment accounts way more than necessary and checking account balances. Glued to financial news of any kind. Tweaking investments all the time always looking for the better bet. In general, constant unease about the future and definitely not able to sleep comfortably at night. I may be exaggerating a bit but I know quite a few people, young and old, that would fit a large part of this description. And I think a large part of these people can overcome these behavioral obstacles, especially by adapting an automatic investment process or system like the ones I discuss on this blog. But I also often wonder if some people would be better off just sticking with investing in 100% cash and never taking any investment risk. They would be much happier. Let’s take that as a given and see how much could such a person expect to reasonably withdraw from their cash portfolio in retirement (which also determined what size portfolio such a person would need to retire). Let’s find out. Using the database I use to calculate SWRs (see here for an example), I replaced the U.S. 10 year bond returns with the historical series for the U.S. 3 month T Bill from 1929 to 2014 to represent cash returns. This is a pessimistic return series to use for cash returns but it’s the best series with that much history. Normally, even in environments with very low U.S. T Bill rates an investor can get cash returns out to 1 year that are quite a bit higher. For example, even with today’s low T Bill rates of 0.14% or so you can get a 1 year CD at many banks yielding over 1%. Below are the historical SWRs (Safe Withdrawal Rates) for a few scenarios with a 100% cash portfolio. The historical SWR for a 100% cash portfolio is 2.3% using a normal inflation adjusted spending model. That is quite a lot lower than the 4% from a 60/40 U.S. stock bond portfolio but definitely do-able. And definitely a portfolio that would have allowed for many more restful nights. The rest of the table shows what the SWR would be with some tweaks to the spending model. The FCM (floor-ceiling) model adjusts inflation adjusted spending down during bad return years. The spending adjustment column uses the historical fact that retirees’ spending increases less than inflation, between 1-2% less than inflation in fact. Using these better spending models increases the historical SWR to 3.34%. Doesn’t sound too bad now does it? Not too far off from the old 4% rule. But how realistic are these spending scenarios? In my opinion and in my experience the above spending scenarios are easily achievable. Think about what people did before easily accessible and low cost investment options. Investing was something reserved for the wealthy or least very well to do. It’s only in modern times that investing is so widespread and accessible. How did your parents or grandparents plan and survive retirement? If they were like my grandparents they planned and survived retirement through a combination of saving a lot and not spending a lot. There was never any investment talk. Getting them to trust bank CDs took almost 10 years! Yet they made it and were quite happy along the way. Sure, they could have been ‘better off’ but they wouldn’t have been as happy. Now lets turn to a modern and more tangible example, me and my wife Nina. From our base spending level in 2005, we spent 53% less in 2014. Yes, that involved a massive life change. By choice. You can read out it on Nina’s blog and even watch a little video about it. But it was for the better. Infinitely better for us. Oh, and that is in nominal terms. In real dollars, we spend 70% less (inflation has grown 2005 dollars by 20%) than we did in 2005. OK, that’s cheating a bit. At least in the ability to generalize from a very specific and personal choice. So, lets take our spending change since we started RV’ing in 2010. In 2014 we spent 10% less than we did in 2010. Inflation is up 8% since then. In real dollars that means we spend 18% less than we did in 2010. That’s over 3% a year. Obviously that can’t go on forever. And we’re pretty much at the bottom of the curve so to speak. Any further dramatic changes would require a reduction in quality of life which is not acceptable to us. Going forward our goal is to keep spending flat in nominal terms. Worst case to keep pace with inflation. I think that is pretty achievable. Our example just goes to show that controlling your spending so that it grows less than inflation is certainly achievable and not just data from some impersonal random study. The other aspect of future spending is that most people have some type of retirement or pension income that begins in later years. This is mainly social security. So, in order to get a truly realistic picture of the future we need to forecast cashflows on a yearly basis. Then we can get a true picture of what SWRs would look like from a 100% cash portfolio. Kind of like I talked about in this post . Let’s consider a 65 year old couple just beginning retirement, delaying social security until 70, a median social security income of that covers about 40% of their expenses, and controlling their spending so that it grows at 1% less than inflation. Taking this cash flow model and applying it to the historical returns from a 100% cash portfolio gives us a worst case SWR of 4.13% for the 30 year retirement period starting in 1942. Not so harsh a retirement after all. Even in 100% cash. And definitely many more restful nights than an equity heavy portfolio. In conclusion, sometimes taking an extreme position can be quite thought provoking and insightful. Admittedly, that is what I’ve done here. It was also a bit tongue in cheek. I’ve shown that even with a 100% cash portfolio a reasonable retirement can be had by focusing on the other side of the equation, spending, and using some more realistic retirement assumptions. People have been doing it for a long time. A lot longer than they have been investing in broadly diversified portfolios across world wide asset classes and markets. And maybe this thought experiment allows us to worry a bit less about our investments and have some more restful nights for just having thought through these alternative scenarios.