Tag Archives: fn-end

Preserve Purchasing Power With This ETF

By Thomas Boccellari Unexpected inflation can be corrosive to a fixed-income portfolio. While bond investors have had to contend with punishingly low interest rates, they have gotten a reprieve on the inflation front. In large part because of falling energy prices, inflation was only 1.3% over the trailing 12 months through November 2014. Because energy is a key input into nearly every aspect of the U.S. economy, it has a big impact on the total cost of production from everything from food and clothing to housing and transportation. Over the trailing 20 years through November 2014, the correlation between WTI Crude and the Consumer Price Index was 0.93. The strength of the U.S. dollar has also been a major contributor to low inflation. Because the eurozone and Japan have weakened their currencies to spur growth in their local markets, the U.S. dollar has strengthened against these currencies. This allows U.S. consumers cheaper access to imported goods from these markets. This is especially important as wage growth remains relatively low in the United States. Because of these trends, expected inflation is low. As of Jan. 12, 2015, the 10-year Treasury’s yield was 1.92%, while the yield of the 10-year TIPS was 0.35%. This implies a break-even inflation rate of 1.57%. The break-even inflation rate is the level inflation would have to increase above before investors would earn higher real returns in Treasury Inflation-Protected Securities. Over the trailing 20 years through November 2014, the average break-even inflation rate was 2.2%. Investors who believe that the long-term inflation will exceed the low-inflation expectations currently priced into traditional bonds may consider a TIPS exchange-traded fund such as Schwab US TIPS ETF (NYSEARCA: SCHP ) –the lowest-cost TIPS ETF available. This fund tracks a broad, market-cap-weighted portfolio of TIPS with more than a year left until maturity. Because TIPS are excluded from aggregate bond ETFs, this fund can be used as a complementary core holding for investors who own an aggregate bond market ETF such as Schwab U.S. Aggregate Bond ETF (NYSEARCA: SCHZ ) (0.06% expense ratio). Because more than half of the fund’s assets were invested in TIPS with maturities greater than seven years, at the end of December 2014, it had a longer duration (7.7 years) than the non-inflation-protected Barclays U.S. Treasury Bond Index (5.7 years). Duration is a measure of interest-rate sensitivity. Therefore, if interest rates were to increase 1%, investors could expect the fund and the Barclays U.S. Treasury Bond Index to decline by 7.7% and 5.7%, respectively. Generally, TIPS’ inflation adjustment is paid at maturity but taxed annually. To make tax time easier, the fund distributes inflation adjustments to the principal in addition to the coupon payment on a monthly basis. However, the fund may suspend interest payments during periods of deflation. This is because the inflation adjustment will become negative and will be offset against the coupon payments. Fundamental View TIPS combine the security of Treasuries with inflation protection in the form of Consumer Price Index-adjusted principal. The CPI represents the cost of a broad basket of goods and services. Inflation will drive the price of that basket higher, and deflation will make it cheaper. When the CPI goes up, a TIPS’ principal is adjusted upward accordingly. Even though the interest rate on the bond remains the same, the semiannual coupon is paid based on the adjusted principal. Inflation may still not rise substantially enough for TIPS to make sense. If interest rates remain consistent or rise slowly, the fund will likely underperform comparable non-inflation-protected bonds. For example, over the trailing six months through November 2014, U.S. inflation fell to 1.3% from 2.1%. Over this time period, the fund’s return (negative 0.7%) was less than that of the Barclays U.S. Treasury 7-10 Year Index (3.1%). However, if the inflation rate increases rapidly, the fund is likely to outperform the Barclays U.S. Treasury 7-10 Year Index. When the inflation rate increased to 2.1% in June 2014 from 0.9% in October 2013, the fund’s return (3.6%) exceeded that of the index (3.1%). The fund’s long duration (7.7 years) may also negate its inflation-protection benefit. This is because long maturity bonds are more susceptible to changing interest rates, which tend to rise when inflation increases. This is because the Federal Reserve often raises rates in order to curb inflation. If long-term interest rates increase with inflation, it could hurt the fund’s returns. For example, from July 2012 through July 2013, the 10-year Treasury yield increased to 2.6% from 1.5%. Over the same period, inflation increased to 2.0% from 1.4%. Despite the increase in inflation, the fund’s return (negative 4.2%) was less than that of the Barclays U.S. Treasury 7-10 Year Index (negative 3.7%) because of the fund’s longer duration. However, long-term interest rates have historically been less volatile than short-term rates. However, Federal Reserve action generally has a larger impact on short- and intermediate-term yields and less on long-term yields. This is because the Fed relies primarily on open market operations to influence short-term interest rates. If the Fed increases short-term interest rates to curb inflation and long-term rates remain relatively stable, the fund may not experience a significant loss. Portfolio Construction The fund tracks the Barclays U.S. Treasury Inflation Protected Securities (TIPS) Index (Series-L), which includes all TIPS issued that have at least one year left until maturity and $250 million in par value. The index is market-cap-weighted and rebalanced monthly. While TIPS are less liquid than Treasuries, the fund’s full index replication strategy has helped to minimize its index tracking error. Fees The fund charges 0.07% annually and is currently the cheapest TIPS ETF. Over the trailing three years through December 2014, the fund has lagged its benchmark by 0.09%, slightly greater than the amount of its expense ratio. Alternatives The largest and most liquid TIPS ETF is iShares TIPS Bond (NYSEARCA: TIP ) (0.20% expense ratio). It tracks the same index as SCHP. SPDR Barclays TIPS ETF (NYSEARCA: IPE ) (0.1865% expense ratio) tracks the Barclays U.S. Government Inflation-Linked Bond Index. While similar to the index that SCHP and TIP track, IPE requires that TIPSs have a minimum $500 million outstanding. As of December 2014, IPE had a shorter duration (6.1 years) and lower yield (1.8%) than SCHP and TIP. Shorter-duration TIPS indexes are somewhat more correlated to inflation, given their lower interest-rate sensitivity. Vanguard Short-Term Inflation-Protected Securities ETF (NASDAQ: VTIP ) (0.10% expense ratio) tracks an index that targets TIPS with maturities of less than five years. As a result, its duration (1.4 years) is considerably lower than SCHP’s. However, it also has a lower yield (0.9%). Another option is PIMCO 1-5 Year U.S. TIPS ETF (NYSEARCA: STPZ ) (0.20% expense ratio), which tracks a similar index as VTIP. Actively managed PIMCO Real Return (MUTF: PRTNX ) (0.85% expense ratio for A share class) has a Morningstar Analyst Rating of Silver. This fund follows a benchmark of TIPS and inflation-linked bonds but tries to garner additional returns through active bets. Disclosure: Morningstar, Inc. licenses its indexes to institutions for a variety of reasons, including the creation of investment products and the benchmarking of existing products. When licensing indexes for the creation or benchmarking of investment products, Morningstar receives fees that are mainly based on fund assets under management. As of Sept. 30, 2012, AlphaPro Management, BlackRock Asset Management, First Asset, First Trust, Invesco, Merrill Lynch, Northern Trust, Nuveen, and Van Eck license one or more Morningstar indexes for this purpose. These investment products are not sponsored, issued, marketed, or sold by Morningstar. Morningstar does not make any representation regarding the advisability of investing in any investment product based on or benchmarked against a Morningstar index.
Adaptive Asset Allocation: Which Is Better – Quarterly, Monthly, Or Weekly Trading?

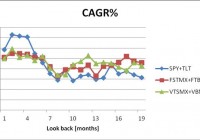
Summary The performance of adaptive asset allocation is sensitive to the look back period, as well as to the frequency of market monitoring. The best performance is obtained by monthly monitoring, which significantly outperforms quarterly or weekly monitoring. For the SPY+TLT pair over the 2004-2014 time interval, the highest CAGRs are as follows: 14.70% for monthly monitoring, 12.93% for quarterly monitoring, and 11.74% for weekly monitoring. The best look back periods are 2 to 7 months, 10 to 20 weeks, and 1 quarter. The relative performance of the adaptive allocation strategy is consistent for ETFs and related mutual funds. We obtained similar effects on (SPY, TLT), (VTI, AGG), (FSTMX, FTBFX), and (VTSMX, VBMFX). In a couple of recent articles , we demonstrated that a very simple and well-diversified portfolio may be made up of two instruments – one representing the total stock market, and the other representing the total bond market. These portfolios are quite robust, and achieve decent returns using simple strategies such as rebalancing and momentum-based adaptive allocation. At the suggestion of some readers, we investigate the sensitivity of the adaptive allocation strategy to the frequency of market monitoring and the duration of the look back period. As in our previous articles, we considered the following four portfolios: one built with the SPDR S&P 500 Trust ETF ( SPY) and the iShares 20+ Year Treasury Bond ETF (NYSEARCA: TLT ) , the second with iShares and Vanguard ETFs, the third with Vanguard mutual funds, and the fourth with Fidelity mutual funds. ETFs portfolio: iShares 20+ Year Treasury Bond ETF and SPDR S&P 500 Trust ETF. ETFs portfolio: iShares Core US Aggregate Bond Market ETF (NYSEARCA: AGG ) and Vanguard Total Stock Market ETF (NYSEARCA: VTI ). Mutual funds portfolio: Vanguard Total Bond Market Index Fund (MUTF: VBMFX ) and Vanguard Total Stock Market Index Fund (MUTF: VTSMX ). Mutual funds portfolio: Fidelity Total Bond Market Index Fund (MUTF: FTBFX ) and Fidelity Spartan Total Stock Market Index Fund (MUTF: FSTMX ). For purposes of comparison, we simulate these portfolios from December 2003 to December 2014, a total of eleven years. The time period of the study was selected based on the availability of historical data of the investment instruments; AGG was created in September 2003. The data for the study were downloaded from Yahoo Finance, using the Historical Prices menu for the eight tickers: SPY, TLT, AGG, VTI, VBMFX, VTSTX, FTBFX, FSTMX. We use the weekly and monthly price data from September 2003 to December 2014, adjusted for stock splits and dividend payments. The article has two parts. In the first part, we discuss the effect of the frequency of market monitoring. The second part presents the effect of varying the look back period. Part I: Quarterly, Monthly, and Weekly Market Monitoring The first study was done on the SPY+TLT. We compare the results obtained by monitoring the market quarterly, monthly, or weekly in the following manner. Quarterly monitoring is done at market closing on the last trading day of each quarter. Monthly monitoring is done at market closing on the last trading day of each month. Weekly monitoring is done at market closing on the last trading day of each week. The portfolio is at all times invested 100% in either SPY or TLT. All the funds are invested in the instrument with the highest return over the current look back period. The following look back periods were utilized in our simulations: 1 to 4 quarters for quarterly monitoring; 2 to 20 months for monthly monitoring; 5 to 50 weeks for weekly monitoring. The data below show the best investment results over 11 years, from January 2004 to December 2014. The first line is for quarterly monitoring with a 1-quarter look back period; the second is for monthly monitoring with a 3-month look back period; the third for weekly monitoring with a 13-week look back period. It is apparent that monthly monitoring delivers significantly better results than weekly or quarterly monitoring. Table 1. SPY+TLT quarterly, monthly, and weekly monitoring of portfolios January 2004-December 2014 Total Return% CAGR% Max DD% Number of trades Quarterly 281.1 12.93 -19.59 22 Monthly 347.0 14.70 -17.13 29 Weekly 141.1 11,74 -17.37 60 Part II: The Effect of the Look Back Period The effect of the look back period is presented separately for quarterly, monthly, and weekly monitoring. For quarterly monitoring , the look back period was varied from 1 quarter to 4 quarters. The results obtained for the SPY+TLT portfolio are shown in Table 2. It is apparent that a look back of one quarter is significantly better than any other period. Table 2. SPY+TLT quarterly, look back periods from 1 to 4 quarters January 2004-December 2014 Look back [quarters] Total Return% CAGR% Max DD% Number of trades 1 281.1 12.93 -19.59 22 2 77.2 5.20 -29.80 17 3 77.6 5.21 -31.54 14 4 56.4 4.15 -36.75 12 For monthly monitoring , the look back period was varied from 2 months to 20 months. The first two figures show the scatter of the compound annual growth rate (CAGR). A few observations can be made from analyzing these results: The SPY+TLT portfolio is the most sensitive to a change in the look back period. A look back period between 2 and 4 delivers the highest returns. VTI+AGG, as well as the mutual fund portfolios are little sensitive to changes in the look back period. Still, a look back period in the 2-6 month range delivers higher returns. (click to enlarge) Figure 1. CAGR for monthly monitoring with look back periods from 2 to 20 months. Source: This chart is based on Excel calculations using the adjusted monthly closing share prices of securities. (click to enlarge) Figure 2. CAGR for monthly monitoring with look back periods from 2 to 20 months. Source: This chart is based on Excel calculations using the adjusted monthly closing share prices of securities. (click to enlarge) Figure 3. Maximum drawdown (DD) for monthly monitoring with look back periods from 2 to 20 months. Source: This chart is based on Excel calculations using the adjusted monthly closing share prices of securities. (click to enlarge) Figure 4. Maximum drawdown for monthly monitoring with look back periods from 2 to 20 months. Source: This chart is based on Excel calculations using the adjusted monthly closing share prices of securities. For weekly monitoring , the look back period was varied from 5 weeks to 50 weeks. The first two figures show the scatter of the compound annual growth rate . A few observations can be made from analyzing these results: The SPY+TLT portfolio is the most sensitive to a change in the look back period. A look back period between 10 and 21 weeks delivers the highest returns. VTI+AGG, as well as the mutual fund portfolios are not very sensitive to changes in the look back period. (click to enlarge) Figure 5. CAGR for weekly monitoring with look back periods from 5 to 50 weeks. Source: This chart is based on Excel calculations using the adjusted weekly closing share prices of securities. (click to enlarge) Figure 6. CAGR for weekly monitoring with look back periods from 5 to 50 weeks. Source: This chart is based on Excel calculations using the adjusted weekly closing share prices of securities. (click to enlarge) Figure 7. Maximum drawdown for weekly monitoring with look back periods from 5 to 50 weeks. Source: This chart is based on Excel calculations using the adjusted weekly closing share prices of securities. (click to enlarge) Figure 8. Maximum drawdown for weekly monitoring with look back periods from 5 to 50 weeks. Source: This chart is based on Excel calculations using the adjusted weekly closing share prices of securities. Conclusions The performance of adaptive asset allocation is sensitive to the look back period, as well as to the frequency of market monitoring. The best performance is obtained by monthly monitoring, which significantly outperforms quarterly or weekly monitoring. The optimal look back period varies with the type of assets that make up the portfolio. For the assets considered in this study, the best look back periods are 2 to 7 months, 10 to 20 weeks, and 1 quarter. The author prefers a look back period of 3 months in conjunction with monthly monitoring.

Which Are The Green Alternative Energy Mutual Funds?

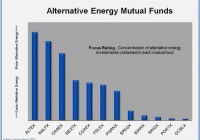
Summary There is a wide range of how focused the different green mutual funds are on alternative energy. Some stocks that a mutual fund may hold are easy to classify as alternative energy companies, others are not. Mutual Funds with the greatest alternative energy focus are ALTEX, NALFX and GAAEX. Not all alternative energy mutual funds are created equal. In a recent interview with the Wall Street Journal , a reporter asked me which alternative energy mutual funds were the most focused on renewables, noting that many mutual funds hold non-energy related companies such as Apple (NASDAQ: AAPL ), PepsiCo (NYSE: PEP ) and Google (NASDAQ: GOOG ). The answer to this question is not as straight forward as one might think. This article sorts out which mutual funds are truly invested in the dynamic and growing green energy sector, and which ones are more peripheral. Greener Than Thou-Revealing How Much a Mutual Fund is Focused on Alternative Energy Despite the desire of many investors to keep their portfolios clean of polluting investments, there is no perfectly pure alternative energy mutual fund. There is, however, a wide range of how focused the different green mutual funds are on alternative energy. Finding out which mutual funds have the highest concentration of alternative energy investments takes a multipronged approach. First, the Roen Financial Report scrutinizes the prospectus of each fund to see if its principles align with alternative energy investment goals. Second, for each company that the mutual fund holds, the annual report and financial filings are thoroughly examined to determine exactly how much of a company’s operations are related to the various green sectors that the Roen Financial Report covers – energy efficiency, environmental * , fuel alternatives, smart grid, solar and wind. Sometimes it is easy to tell whether a mutual fund holds stocks that are in one or more of the alternative energy sectors, but in other cases it is not so obvious. Clearly, pure play companies like First Solar, Inc (NASDAQ: FSLR ), Renewable Energy Group Inc (NASDAQ: REGI ) and SolarCity Corp (NASDAQ: SCTY ) are stocks that alternative energy investors are seeking. There are other companies, though, that have alternative energy products and services as part of their business model, but those operations are not the company’s bread-and-butter. For example, Johnson Controls (NYSE: JCI ) is a large industrial conglomerate that has two business units which address alternative energy themes -building efficiency and renewable power solutions. I estimate that alternative energy accounts for perhaps half of JCI’s revenues. Interestingly, shares of JCI are owned by 8 out of 12 alternative energy mutual funds, more than any other single company. Another example of a company with partial alternative energy operations is Valmont Industries (NYSE: VMI ). Valmont manufactures support towers for wind turbines, anemometers, power line transmission, mass transit poles, lighting and related structures. This company cannot be ignored-its contribution is critical to the infrastructure needed to support utility-scale solar, wind and smart grid projects that will continue to be built over the coming decades. However, my analysis attributes an estimated 15% of Valmont’s current earnings are a result of alternative energy projects. Google is another company that blurs into alternative energy, though it is obviously not its main business. Google realizes that it is basically an electricity-based service-no electricity, no Google. Because of this, Google has made a significant commitment to moving toward a more clean and sustainable electric supply. Google has moved on this in no small way, having invested in over $1.5 billion in wind and solar projects . In order to simplify the analysis of how much of a stocks business relates to alternative energy, only the stocks needed to reach at least 50% of a fund’s weighted holdings were included (or at a minimum, the fund’s top 10 holdings). Also, two mutual funds that the Roen Financial Report tracks were left out of the rating system, Allianz RCM Global Water A (MUTF: AWTAX ) and Calvert Green Bond A (MUTF: CGAFX ). AWATX invests in stocks and securities engaged in water-related activities, a sector related to green energy but with more of an environmental focus. Calvert Green Bond is another good choice for green investors, but is a different kind of animal than a stock fund, so it is hard to make an apples-to-apples comparison. Its prospectus states that investments include: …securities of companies that develop or provide products or services that address environmental solutions and/or support efforts to reduce their own environmental footprint; bonds that support environmental projects; structured securities that are collateralized by assets supporting environmental themes; and securities that, in the opinion of the Fund’s Advisor, have no more than a negligible direct environmental impact, which may include securities issued by the U.S. government or its agencies, and U.S. government-sponsored entities. The Greenest Alternative Energy Mutual Funds (click to enlarge) Three funds clearly top the list of having the greatest alternative energy focus: Firsthand Alternative Energy (MUTF: ALTEX ), New Alternatives (MUTF: NALFX ) and Guinness Atkinson Alternative Energy (MUTF: GAAEX ). These funds have a high concentration of alternative energy investments, and strongly focused investment principles. Firsthand Alternative Energy Five of Firsthand Alternative Energy’s top 10 weighted holdings are pure play companies such as First Solar , Sun Power (NASDAQ: SPWR ) and Solar City . Firsthand Alternative Energy is very specific in their prospectus, stating that they: …invest at least 80% of the Fund’s assets in alternative energy and alternative energy technology companies, both U.S. and international. Alternative energy currently includes energy generated through solar, hydrogen, wind, geothermal, hydroelectric, tidal, biofuel, and biomass. Alternative energy technologies currently include, but are not limited to, technologies that enable energies to be tapped, stored, or transported, such as fuel cells; services or technologies that conserve or enable more efficient utilization of energy; and technologies that help minimize harmful emissions from existing energy sources, such as helping reduce carbon emissions. It is important to note that ALTEX is the smallest of all alternative energy funds that the Roen Financial Report tracks, and we give this fund a low overall investment rank. New Alternatives New Alternatives Fund also has a very good concentration of alternative energy investments. The top six of its holdings are 100% pure play alternative energy companies. Additionally, the top 50% of its weighted portfolio is estimated to be over 75% involved in alternative energy. The investment objective of the fund is not the strongest of all alternative energy funds, but it is very specific: At least 25% of the Fund’s total assets will be invested in equity securities of companies in the alternative energy industry. ‘Alternative Energy’ means the production and conservation of energy in a manner that reduces pollution and harm to the environment, particularly when compared to conventional coal, oil or nuclear energy… The Advisor also considers the perceived prospects for the company and its industry, with concern for economic, political and social conditions at the time. In addition the Advisor considers its expectations for the investment based on, among other things, the company’s technological and management strength. Guinness Atkinson Alternative Energy GAAEX has a very strong concentration of alternative energy companies in its portfolio. When looking at the top two-thirds of its holdings, about 90% of those investments are involved in green energy production. Guinness Atkinson Alternative Energy also has one of the tightest investment principles guiding the fund: The Alternative Energy Fund invests at least 80% of its net assets in equity securities of alternative energy companies (both U.S. and non-U.S.). Alternative energy companies include, but are not limited to companies that generate power through solar, wind, hydroelectric, tidal wave, geothermal, biomass or biofuels and the various companies that provide the equipment and technologies that enable these sources to be tapped, used, stored or transported, including companies that create, facilitate or improve technologies that conserve or enable more efficient use of energy. Mutual Funds With a Lesser Alternative Energy Focus Funds that the Roen Financial Report rate as having the least alternative energy stocks are Gabelli SRI Green AAA (MUTF: SRIGX ), Portfolio 21 R (MUTF: PORTX ) and Green Century Balanced Fund (MUTF: GCBLX ). Gabelli SRI AAA Prior to last year, Gabelli SRI AAA had more of an alternative energy focus (its previous name was The Gabelli SRI Green Fund), but is now a social screened fund. It does, however, include some alternative energy holdings, such as JCI and VMI. Its investment objectives show that SRIGX has more of an exclusionary screen than a proactive green energy focus: Pursuant to the guidelines, the Fund will not invest in the top 50 defense/weapons contractors or in companies that derive more than 5% of their revenues from the following areas: tobacco, alcohol, gaming, defense/weapons production, and companies involved in the manufacture of abortion related products. Portfolio 21 R PORTX is an environmentally focused fund, which also has a broader social charge. Fewer than expected of its holdings, though, have an alternative energy focus. Only about one-third of its portfolio comprises companies that have a hand in alternative energy sectors. Its prospectus states that: The Advisor believes that the best long-term investments are found in companies with above-average financial characteristics and growth potential that also excel at managing environmental risks and opportunities and societal impact… The Advisor considers a company’s position on various factors such as ecological limits, environmental stewardship, environmental strategies, stance on human rights and equality, societal impact as well as its corporate governance practices. Green Century Balanced Fund Green Century Balanced is a mutual fund that invests in environmentally responsible and sustainable companies, and those not directly in the fossil fuel business. Even though its prospectus is very specific about including companies that have environmental goods and services, very few of the top weighted stocks in its portfolio work in green energy. Instead, many of its top holdings are in technology, health care and financial services. Despite this fact, GCBLX does have a detailed and relevant investment objective: The Fund invests primarily in the stocks and bonds of environmentally responsible and sustainable U.S. companies…whose primary business involves the provision of an environmentally sound good or service, such as appropriate technology for sustainable agriculture, renewable energy, energy efficiency, water treatment and conservation, air pollution control, pollution prevention, recycling technologies, or other effective remedies for existing environmental problems. The Fund also invests in companies whose primary business is not solving environmental problems but which conduct their business in an environmentally responsible manner. Such companies are evaluated on a range of criteria that includes, but is not necessarily limited to, an assessment of each company’s: Environmental performance indicators such as its consumption of natural resources, energy usage, greenhouse gas emissions, toxic emissions, use of toxic chemicals, and solid waste generation; Pollution prevention programs and supply chain environmental policies; Compliance with environmental laws and regulations and its potential environmental liabilities; Environmental management infrastructure and governance procedures; Public reporting on an annual basis of its environmental performance… The Balanced Fund does not intend to invest in companies engaged in the extraction, exploration, production, manufacturing or refining of fossil fuels… Summary My analysis clearly shows that there is a wide range in how committed an alternative energy mutual fund may be in its investments. There is a big difference in the holdings of funds like Firsthand Alternative Energy and New Alternatives compared to Green Century. This information should help guide investors interested in green energy mutual funds to help them know what these funds may or may not be holding. * Though not directly involved in alternative energy, environmental stocks include those in the business of recycling, pollution control, clean water supply and related sectors. While their business is related to the goals of alternative energy by reducing pollution and creating a cleaner planet, it is not as directly related as companies in the energy sector. So for the purposes of this analysis, the factor that environmental companies contribute to a mutual fund’s alternative energy focus was reduced. In other words, a water service company like Xylem Inc (NYSE: XYL ) rates lower than a solar panel manufacturer like Trina Solar (NYSE: TSL ).