Tag Archives: fn-end

A New Income Oriented Multi-Asset ETF Hits The Market

Income investing has been on a tear since last year thanks to the plunge in bond yields. Global growth worries, a relentless slide in oil prices, QE talks in the Euro zone, a ‘patient’ Fed and stepped-up stimulus in Japan resulted in easy money policies across the developed world and in turn dragged yields down. This spurred many issuers to put out new products in this income space, greatly enhancing the number of options at investors’ disposal in this key market segment. Many may think that the income investing space is stuffed, leaving no scope for a new theme to perk up investors’ mood. To prove this group wrong, Master Shares recently released a pass-through ETF with an alternative focus, this time on income. The ETF trades under the name of the Master Income ETF (NYSEARCA: HIPS ). Let’s dig deeper. HIPS in Focus The fund looks to track the TFMS HIPS 300 Index, focusing on 300 securities with a pass-through structure. This is done by looking at securities from the sectors including closed-end fund (CEFs), mREITs, commercial/residential/diversified REITs, business development companies and MLPs. The fund charges 87 bps in fees. How Could it Fit in a Portfolio? The fund does look to be a great way to play the alternative securities space in an ETF form, while its yield will be tough to beat. The current period of low interest rates makes this income paying ETF quite attractive. Investors should note that high income paying securities play a defensive role in a portfolio and help to reduce overall volatility in uncertain times. The pass-through structure is basically created to avoid the effects of double taxation. The product could also be an interesting choice for those reluctant to invest in the regular ways of income investing like junk bonds or high-dividend equities. The constituents of the portfolio are un-correlated in nature and bear less relationship with the typical bond and stock exchanges. Thus, barring the income lure, the product should go a long way in hedging marketing volatility in the portfolio. ETF Competition Since the high yield space sees tough competition due to relentless launches over the last two years, the issuer gave this product an unusual packaging to set it apart from the regular pack. Still, some high income products with a focus on alternative securities are presently operating in the market. These include the likes of the ETRACS Diversified High Income ETN (NYSEARCA: DVHI ), the iShares Morningstar Multi-Asset Income Index ETF (BATS: IYLD ), the SPDR Income Allocation ETF (NYSEARCA: INKM ), the Guggenheim Multi-Asset Income ETF (NYSEARCA: CVY ), the First Trust Multi-Asset Diversified Income Index ETF (NASDAQ: MDIV ) and the YieldShares High Income ETF (NYSEARCA: YYY ). Expense ratio wise, the newly launched ETF looks reasonable as other products charge in the range of 60 bps to 165 bps a year. This is especially true given the product’s focus on pass-through entities and wide coverage from CEFs to MLPs. However, to be a winner in a long-distance race, the issuer should dedicatedly focus on the income part of the ETF. Notably, YYY holds the status of the highest yielding product in the space of diversified ETFs, having yielded about 9.6% as of January 13, 2015. To live up to investors’ expectations, the fund should offer something around that high benchmark, otherwise it could be somewhat prohibitive to asset accumulation, at least to those who are highly yield-starved.
Alts Pioneer Calamos Launches A Pair Of Alternative Mutual Funds

Calamos Investments was one of the first firms to launch a liquid alts product in the early 1990s, and the firm maintains its tradition as a trailblazer in the industry with the recent launch of two alternative mutual funds: The Calamos Global Convertible Fund and the Calamos Hedged Equity Income Fund, both of which “leverage core competencies of the firm,” according to a statement issued by Calamos. “These new funds are a logical extension of our product suite,” said John Calamos Jr, CEO and co-CIO of Calamos Investments: We have managed global convertible strategies for institutional clients for 20 years, and have managed U.S. convertibles for more than 35 years. Additionally, we were an early leader in the liquid alternatives space. Both funds were launched on December 31, 2014, and join the lineup of other Calamos convertible and alternative mutual funds, including the following: Calamos Convertible Fund (MUTF: CCVIX ) – A $1.3 billion fund that was launched in June 1985 and focuses on the U.S. convertible bond market. Calamos Long/Short Fund (MUTF: CALSX ) – A $57 million long/short equity fund with a focus on the U.S. equity market. The fund was launched in June 2013. Calamos Market Neutral Income Fund (MUTF: CVSIX ) – A $4.2 billion fund that started in September 1990 and aims to maintain a low correlation to the U.S. equity and fixed income markets while generating income through covered call writing and convertible arbitrage strategies. The two new funds will be managed by portfolio management teams led by John Calamos, Sr., Chief Executive Officer and Global Co-CIO, and Gary Black, Executive Vice President and Global Co-CIO. Global Convertible Fund The Calamos Global Convertible Fund blends global investment themes and fundamental research, providing broadly diversified exposure to the global convertible bond universe. The fund seeks to provide upside participation in equity markets with less exposure to downside than an equity-only portfolio over a full market cycle. According to Calamos, the fund can also serve a role within a fixed income allocation, as convertibles have historically performed well during periods of rising interest rates and inflation. The fund is available in five different share classes (A Shares: CAGCX ; C Shares: CCGCX ; R Shares: CRGCX ; I Shares: CXGCX ), has a management fee of 0.85% and expense ratios of 1.35%, 2.10%, 1.60%, and 1.10%, respectively. Further information can be found on the fund’s website . Hedged Equity Income Fund The Calamos Hedged Equity Income Fund invests in a diversified portfolio of stocks and sells options with the aim of generating income while participating in equity market upside with lower volatility over the long term. The Calamos Hedged Equity Income Fund is also available in four share classes ((A Shares: CAHEX ; C Shares: CCHEX ; R Shares: CRHEX ; I Shares: CIHEX ), has a management fee of 0.75% and expense ratios of 1.25%, 2.00%, 1.50% and 1.00%, respectively. Further information can be found on the fund’s website .

S&P 500 FCF Analysis: What You Do Depends On Who You Are

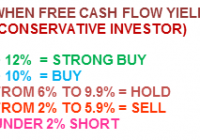
Analysis of the S&P 500 Index and its individual components using the “Free Cash Flow Yield” ratio. Specifically written to assist those Seeking Alpha readers who are using my free cash flow system. Generates a final result for the S&P 500 Index and explains that result to each reader depending an what type of investor they are. Back in December of last year, I introduced my free cash flow system here on Seeking Alpha, through a series of articles that you can view by going to my SA profile . My purpose in doing so was to try and teach as many investors as I could, on how to do this simple analysis on their own, as I believe in the following: “Give a person a fish and you feed them for a day, Teach a person to fish and you feed them for life” I have been very pleased with the positive feedback that I have received so far, but included in that feedback were many requests by those using my system, to see if they did their analysis correctly or not. Since the rate of these requests has been increasing with every new article I write, I have decided to start a new series of articles here on Seeking Alpha analyzing the S&P 500 Index, where I will analyze each of its components individually. That way those of you using my system will have something like a “teacher’s edition” that will give you all the correct calculations for each component. Obviously I can’t include the results for all my ratios in one article, so I will thus be doing a series of articles, where each ratio’s results for the S&P 500 Index will have its own article devoted to it. Hopefully these articles can be used as reference guides that everyone can use over and over again, whenever the need arises. Having said that, at the same time we will be “killing two birds with one stone” as we will also be analyzing the S&P 500 Index and give one final result for it as well as its individual components . That way these series of articles will also be able to give us a real time analysis of whether the S&P 500 Index is attractively priced or overvalued. In order to save space in this article (as the table that will soon follow is quite long) I would welcome everyone to read my article on how to analyze a portfolio/Index by clicking on the following link first: Warren Buffet s Berkshire Hathaway Portfolio: A Free Cash Flow Analysis That way those of you who are new to this analysis will get a complete introduction and for others already familiar with my work, let it act as a refresher course. This article with concentrate on my “Free Cash Flow Yield Ratio” Free Cash Flow Yield = Free Cash Flow per Share / Stock Market Price One key point to always remember in using this system, is that it is designed for all kinds of investors, whether you would be conservative (like I am) or a more aggressive/buy & hold investor. I have created the following parameters for each type and they are as follows: Finally it is also important to understand that I personally do not invest in financial firms as a rule, because it is quite difficult to get a very accurate free cash flow result. This is so because financial firms generate very little in the way of capital expenditures, thus the results you find below are basically just cash flow from operations. I still analyze them as they are part of the S&P 500 Index, but again I don’t invest in them as I find financial firms too complicated to analyze. This belief of not investing in financials, saved me from suffering the huge losses that this sector suffered in 2008-2009, which cost investors dearly. For those who disagree we can start a discussion on the matter in the comment section below, which will allow me to further elaborate on the matter. So without further ado here is my “Free Cash Flow Yield Analysis of the S&P 500 Index (NYSEARCA: SPY ) and its components: (click to enlarge) The final free cash flow yield result of 5.11% for the S&P 500 Index would be classified as a ” Strong Hold” for the more aggressive/ buy & hold investor and a “Weak Sell” for the more conservative investor, using the parameter tables I included at the beginning of the article . The weightings that you see in the index were generated by mirroring those used in the SPDR S&P 500 ETF . Also remember that the results shown above are just for one ratio and that this is not investment advice, but just the results of the ratio. The system outlined in this article and all that will follow, as part of this series, are just meant to be used as reference material to be included as just “one” part of everyone’s own due diligence. So in other words, don’t make investment decisions based on just this one result, but incorporate it as one part of your own due diligence.