Tag Archives: fn-end

Spike In eBay Shares On Q4 Earnings Puts These ETFs In Focus

The e-commerce giant eBay Inc (NASDAQ: EBAY ) came out with Q4 results after the closing bell on January 21. Overall, the mood was optimistic on an earnings beat and restructuring initiatives, though a sales-miss restrained investors from full-hearted optimism on the stock. Net income in the fourth quarter rose to $0.81 from $0.66 per share a year earlier, based on Zacks data. This beat the Zacks Consensus Estimate of $0.77, which excludes stock options and non-recurring expenses. Net revenues of $4.92 billion fell shy of the estimate of $4.97 billion but grew 9% year over year. Revenues were primarily volume driven. eBay’s Marketplaces segment generating revenues from the sale of goods available on eBay properties, recorded a 1% jump in net transaction revenues. However, as expected, pricing was an issue for the company which is why on the margin front, the e-commerce giant clearly underperformed. The non-GAAP operating margin was down 150 bps to 29.2% in the quarter. Restructuring procedure is on with the e-commerce player. eBay’s plan to spin off the PayPal business will be completed in the second half of 2015 and the online marketplace announced that it would lay off 7% of its workforce in the first quarter. The company also announced it has entered into a standstill agreement with Carl Icahn, who is the company’s largest activist shareholder . Weak Guidance Though the story was decent so far, the guidance took a beating. The company expects net revenues in the range of $4.35-$4.45 billion, failing the analysts’ projection of $4.71 billion, per Bloomberg . The company’s non-GAAP earnings per share are guided in the range of $0.68-$0.71. The company expects net revenues of $18.60-$19.1 billion for the full year and non-GAAP earnings per diluted share of $3.05-$3.15. Market Impact The company’s streamlining initiatives might have given its stock a boost post earnings. The stock gained 3.5% after hours on January 21. The results have put some ETFs with considerable exposure to eBay in focus. These funds are highlighted below: PowerShares Nasdaq Internet Portfolio (NASDAQ: PNQI ) This fund follows the Nasdaq Internet Index, giving investors exposure to the broad Internet industry. The fund holds about 94 stocks in its basket with AUM of $248 million while charging 60 bps in fees per year. The in-focus eBay occupies the second position with an 8.37% allocation. In terms of industrial exposure, Internet software and services make up for more than two-thirds of the basket, followed by Internet retail. PNQI has lost nearly 2.2% so far this year (as of January 21, 2015). First Trust Dow Jones Internet Index (NYSEARCA: FDN ) This is one of the most popular and liquid ETFs in the broad tech space with AUM of over $1.96 billion and average daily volume of more than 250,000 shares. The fund tracks the Dow Jones Internet Index and charges 57 bps in fees per year. In total, the fund holds 41 stocks in its basket with the in-focus eBay taking the third spot with a 5.53% share. From a sector look, information technology accounts for about 70% of the portfolio while consumer discretionary makes up 22%. The ETF is down about 2.9% year to date. Market Vectors Wide Moat ETF (NYSEARCA: MOAT ) This ETF follows the Morningstar Wide Moat Focus Index and provides equal-weighted exposure to 21 U.S. securities that have a unique sustainable competitive advantage in their respective industries. Here, eBay occupies the tenth position in the basket, accounting for 5% of total assets. The product is pretty spread out across various sectors with energy, information technology and consumer discretionary taking double-digit allocation. The fund has accumulated $898 million in its asset base and sees good volume of about 200,000 shares a day. Its expense ratio comes in at 0.49%. The fund has added nearly 5% so far this year. Bottom Line eBay currently carries a Zacks Rank #4 (Sell) with poor fundamentals. However, investors should note that Internet commerce segment – the industry eBay operates in – presently resides in the top 23% allocation of Zacks Industry Rank. The company itself is also striving hard to turn around by adopting every possible measure. All these point to a moderately bullish long-term outlook. So, investors counting on the long-term potential in the space can consider the recent rally in eBay shares as a start to the wining trend. However, an ETF approach may be better; at least it can cover up eBay’s short-term weakness with some other components’ strength.
Palladium ETF To Enjoy Another Year Of Strong Fundamentals

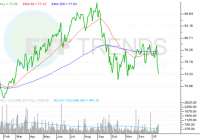
Summary Low gas prices are boosting car sales. As the car industry picks up, increased demand for catalytic converts will help boost palladium prices. Palladium’s role in the industrial space. The palladium-related exchange traded fund could shine this year as low gasoline prices and cheap bank loans help attract more new automobile buyers. The ETFS Physical Palladium Shares (NYSEArca: PALL ) has only increased 1.1% over the past year but could begin to pick up momentum in 2015. The palladium spot price is hovering around $777.3 per ounce Tuesday. Johnson Matthey Plc, a maker of catalytic converters for automobiles that uses palladium to reduce harmful emissions, projects demand for the precious metal will likely exceed supply for a fourth consecutive year in 2015, reports Laura Clarke for Bloomberg . Fueling the increased palladium demand, global car sales increased 3.4% in 2014 to a record 81.6 million vehicles. In the U.S., auto sales rose to an annualized rate of 17.2 million, the highest since November 2003. Morgan Stanley and Deutsche Bank AG both remain bullish on the palladium outlook because 70% of palladium demand comes from car-parts manufacturers. Specifically, an ounce of palladium supplies enough catalytic converters in about 10 vehicles. “Palladium is an exciting place to be because of its exposure to gasoline,” Scott Winship, a fund manager at Investec Asset Management, said in the article. “U.S. auto demand is incredibly strong and might even surpass previous peaks that we saw before the financial crisis.” Bolstering U.S. auto sales, near-zero interest rates, a stronger job market and cheap fuel costs are allowing American consumers to finally purchase some big-ticket items that they pushed off in the wake of the financial crisis. Cheaper fuel “might attract some drivers to buy a car when they otherwise wouldn’t have,” Jonathon Poskitt, the head of sales forecasting for Europe at LMC Automotive Ltd., said in the article. However, palladium investors may be wary of prices rising too quickly. When palladium jumped to a record in 2001, carmakers cut palladium demand by 40% the following year and shifted into platinum as a cheaper alternative. On the supply side, production has lagged consumption since 2012, with output declining in Russia and South Africa, the world’s top producers. Deutsche Bank calculates that the shortfall could diminish to 907,000 in ounces this year, compared to 1.2 million ounces in 2014, and the market will continue to see production deficits until at least 2020. “There’s a very bullish story there that’s going to play out in the long term,” Jeremy Baker, senior commodity strategist at Harcourt Investment Consulting AG, said in the article. “There is a good argument that palladium should outperform other precious metals.” ETFS Physical Palladium Shares (click to enlarge) Max Chen contributed to this article .

Why Indexing And ‘Smart Beta’ Are So Popular

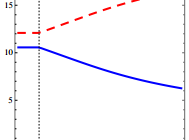
By Jack Vogel, Ph.D. Asset Manager Contracts and Equilibrium Prices Abstract: We study the joint determination of fund managers’ contracts and equilibrium asset prices. Because of agency frictions, investors make managers’ fees more sensitive to performance and benchmark performance against a market index. This makes managers unwilling to deviate from the index and exacerbates price distortions. Because trading against overvaluation exposes managers to greater risk of deviating from the index than trading against undervaluation, agency frictions bias the aggregate market upwards. They can also generate a negative relationship between risk and return because they raise the volatility of overvalued assets. Socially optimal contracts provide steeper performance incentives and cause larger pricing distortions than privately optimal contracts. Core Idea: This is a theoretical paper, so proceed with caution! However, the paper does a good job discussing the Principal/Agent Problem . Briefly stated, the “principal/agent problem” relates to how the interests of agents, who act on behalf of principals, can conflict with those of the principals. In investing, when an asset manager’s performance (or fees) is measured or benchmarked relative to an index, the potential friction (of losing fees and possibly their job) causes the manager to track closer to the index. Here is a quote from the paper: Benchmarking, however, only incentivizes the manager to take risk that correlates closely with the index, and discourages deviations from that benchmark. Thus, the manager becomes less willing to overweight assets in low demand by buy-and-hold investors, and to underweight assets in high demand. The former assets become more undervalued in equilibrium, and the latter assets become more overvalued. Within this theoretical framework, how are asset prices affected? In the graphs below, the blue solid line represents assets in large supply, and the red dashed line assets in small supply. Notice in the graph, that the more expensive asset has lower supply, while the less expensive asset has higher supply! Not surprisingly, the expected return is inverted, where the asset with less supply and is more expensive has lower expected returns, while the asset with high supply and lower price has higher expected returns. Additionally, these assets with higher (lower) supply have lower (higher) volatility. See the paper for details on why this may be so. Note, however, that if an expensive (overvalued) asset with higher volatility has a positive shock to expected cash flows, it would account for a larger portion of market movement. For this reason, managers are reluctant not to hold it, and instead will buy it, since they fear that failing to buy it may cause them to deviate from the benchmark. The main conclusion is that in this theoretical world, asset managers tend to hug the index, as their fees are tied to the index, and thus they are loath to do things that might cause them to depart from it. In the real world, this makes sense as well. Imagine the following two investment strategies that an institutional money manger must pick from: With 98% certainty, you are going to beat the index by 5% over the next 10 years. The other 2% of the time, you will lose to the index by 1%. However, you know that 3 of the years you may lose by as much as 8%! So while the long run expected returns are quite high, the return path to get there is very noisy and volatile. With 50% certainty, you are going to beat the index by 1% over the next 10 years. The other 50% of the time, you will lose to the index by 0.50%. In any given year, you will be +/- 0.25% relative to the index. Here, the long run expected returns are comparatively lower, but the return path is stable. Now, from a mathematical and economist perspective, there is an easy solution — calculate the expected value. Expected Value = beat index by (0.98%)(5%) + (2%)(-1%) = beat index by 4.88% Expected Value = beat index by (0.50%)(1%) + (50%)(-0.5%) = beat index by 0.50 % Any economist would pick option 1! It’s a slam dunk. However, the asset manager knows that picking option 1 is risky to him as an agent, as he might lose his job if the principal (owner of money) loses faith in his strategy. Ever wonder why smart beta products run rampant in the marketplace? It’s because smart beta has low tracking error versus the index. Although expected returns are modest, the manager will remain withing hailing distance of the benchmark, and a principal can’t complain too much about that, right? Unfortunately, this may not necessarily be in the principal’s best interests. Original Post