Tag Archives: fn-end

Where To Invest In 2015 In Asian Emerging Markets

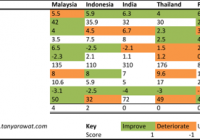
We are at crossroads of diverging monetary policies. GRI’s analyst Tanya Rawat breaks down what this means for investment in emerging markets (EM) in Asia. The U.S. gets ready to tighten policy rates whereas the Eurozone and Japan have adopted easing measures to invigorate economies at a risk of falling into a disinflationary cycle if not deflationary. Taking account of this paradigm shift, the lure of high carry, which some of the high yielding Asian currencies offer will no longer suffice, especially if U.S. Treasury yields were to rise quickly as well. The differentiating factor then in choosing the right investment destination in emerging market (EM) Asia will be domestic stability, external fundamental factors viz. current account balances, FX reserves, percentage of short-term liabilities backed by these reserves, robustness of FX policy and the credibility of the central banks. We use a rather simple scorecard methodology to choose probable winner and losers: (click to enlarge) Korea is the only the country with a positive fiscal balance and as a function of it, the lowest gross public sector debt. Add to this the layer of currency sensitivity to rising US interest rates, in 2014, the Korean Won performed the best with high core balance (current account balance + net FDI, both as a % of GDP), low real interest rates, REER undervaluation when compared to historical levels, a low leverage economy, high fiscal balance (% GDP), low gross public sector debt (% GDP) i.e. less susceptible to inflation and lastly sufficient FX cover. However, it does remain receptive to competitiveness from a weaker Yen and China’s growth uncertainty (largest export partners are China and the U.S.). Taiwan has the highest current account surplus, large FX Reserves and the highest import cover in the EM Asia universe. This makes it extremely robust to external shocks and there still remains room for inflation to catch up with the rest of the countries. While Malaysia scores well, investors should be sceptical as external FX vulnerability (exposure to changes in US rates) remains its Achilles’ heel and the country is also highly leveraged (household debt 86% of GDP). The Central bank has been sluggish in raising interest rates to curb this activity; the first hike of 25 bps since 2011 took place in the latter of 2014. Malaysia is a net oil exporter and thus remains to benefit the least from lower oil prices. Indonesia with the lowest current account balances (% GDP), import cover and highest short-term external debt (% of FX reserves), also remains quite vulnerable to US rate hikes. Also, it is one of only two countries on the planet with twin deficits; the other being India. However, the fiscal balance looks set to improve as the government stands to save highly due to elimination of fuel subsidy supported by lower oil prices, which now renders the current price cheaper than the subsidized rates. While India is neutral due to low core balance, low import cover and short-term external debt cover, it is positive that falling oil renders an improving current account balance, government savings on energy subsidies and ‘Modinomics’ that ensures momentum in economic reforms. Currently, all three rating agencies have India on a ‘Stable’ rating. Apart from offering the highest carry, inflation is trending lower as commodity prices continue to fall (CPI has a high sensitivity to energy prices) and monetary policy remains robust and supportive. Also, the Indian Central bank is keen to shift to inflation targeting from 2016 onwards (4% with deviation +/-2%). Thus far it has been enhancing credibility, largely by following prudent FX policy – absorbing portfolio inflows when they are strong and selling dollars when sentiment weakens. Reforms in the food market, rising investment in agriculture and a boost to rural productivity are necessary steps in the flight against persistently high inflation in India. Philippines and Thailand both have one of the lowest FX reserves in the world and food constitutes a high percentage of their CPI. Additionally, they do not fare well compared to other regions due to rising leverage and/or fiscal deficit, high portfolio liabilities and weaker core balances. Finally, while China offers the highest GDP growth (y-o-y) and has the largest FX reserves, it has one of the lowest current account balances (% GDP). Although signs of a fundamental slowdown in the economy became evident last year, the market was still one of the best performers in the world. This disconnect is worrying as the rapid increase in momentum came close in the heels of the opening the Chinese market to international investors via Stock-Connect. Recently, stimulus ‘steps’ are a case in point that the government is aware of this slowdown and is taking appropriate steps to alleviate the same. Investors should be skeptical of the China story simply on the basis that this time the stock market is lagging economic indicators, which maybe seen acting as a precedent to a deeper fundamental problem. Spending by the government may turn China into only the third region in the EM Asia universe with a twin deficit. (click to enlarge) (click to enlarge) 1-year (2013-14) performance of Asian EM currencies. Spot returns were trivial, while yield chasing was the norm given the rather benign carry environment. On such a playing field, the Indian Rupee was the prime victor (1M NDF Implied Yields). (Source: Bloomberg) (click to enlarge) With lower oil prices, Thailand, Indonesia, Taiwan and India standing to be relative gainers with Malaysia standing to lose as it is the only net exporter. (click to enlarge) Sensitivity of headline CPI changes to changes in energy costs. (click to enlarge) Even if the pass-through to consumer inflation is muted (as corporations will prefer to remain sluggish in lowering oil prices to maintain profitability), governments will eventually save on subsidies.
Why Dave Ramsey Is Wrong

There is no denying that Dave Ramsey has done a commendable job of bringing back our grandparents’ financial values into popular culture. Many Americans have been poor stewards of their finances and have been saddled with avoidable debt. Ramsey’s advice has helped thousands get back on the right financial track. Even at my own company, we use the debt snowball of Financial Peace University to help right the finances of our pro-bono planning clients. Ramsey has become a multimillionaire by simply telling people to live within their means by creating and maintaining their household budget. Certainly, in today’s society of zero interest and only three easy payments of $19.99, this is no simple task. However, once a person overcomes modern-day financial temptation and begins investing in his or her future, Ramsey drops the ball and becomes a spokesperson for one of the most confusing industries in America, financial product sales. Ramsey recommends his followers work with brokers who are paid high commissions for investing in mutual funds. Ramsey, as popular as he is – and no one disputes that – has missed the boat on one thing – dismissing the credibility and sensibility of a fiduciary and fee-only financial advisor. That may not sound like a big deal, until you understand that picking the right financial advisor can lead to an overall stronger financial foundation for your family, your future and your state of mind. Let’s look at this a bit closer. The Fee-Only Advantage Fiduciary (your best interest) fee-only advisors take a different approach to investing. There are no selling products; fee-only advisors are not paid a commission from a product. This removes the conflict of interest that brokers carry in their relationships with their clients. This also causes the advisor to look differently at the product that he or she recommends to the client, which is why we see a much higher usage of index funds from the fee-only community. These highly diversified funds carry very low fees, because they don’t pay any advisor any commission, and historically have beat actively managed, commission mutual funds over long periods of time. A well-diversified index fund portfolio should cost no more that 0.25% a year, with most of the funds trading at no charge. Fee-only advisors are compensated as a percentage of assets they manage, by a flat monthly retainer, or bill hourly for financial planning. Each of these options are free from any conflict that the advisor gives to the client. Most fee-only firms also include financial planning in their asset management fees. A financial plan sets how the portfolio should be allocated. Proper asset allocation is a large ingredient to successful long-term investing. A mutual mess Ramsey, on the other hand, encourages his followers to contact a broker within his referral network when they are ready to start investing. In the interest of full disclosure, his network rejected my firm telling me that being a fiduciary fee-only financial services firm we did not qualify because his network is made up of only commission brokers. Ramsey recommends that his flock work with a broker and invest in a mutual fund that has a long track record of good results vs. the S&P 500. He then adds that the investor should purchase and stay put, meaning don’t sell when the market falls, be a buy and hold investor. The broker will collect a 5% +- commission from the sale and will receive a smaller percentage on a quarterly basis, assuming the investor does not sell the fund. Additional investments into the fund, whether it is annually or monthly, will also be charged the large upfront fee. Ramsey supports this model because he believes this to be the cheapest form of investing compared to fee-based firms that would be charging 1.2% a year to give advice and provide planning services. In the 80’s and early 90’s this may have been the correct advice, but unfortunately the US brokerage business has taken a turn for the worst, in that products are not built to benefit the client, they are built to make money for the firm and the broker. A retired executive from a large brokerage company recently told me he got out because his firm no longer focused on the client, they focused on what they could get away with selling to the client. Even if Ramey’s referral network has the best intentions, history is against them. There have been very few mutual funds that actually beat the S&P 500 net of fees over long periods of time. Some get lucky over a 10 year stretch, but after 15 years the list is very short. Historically we see less than 1% of funds beat the S&P 500 (after fees) over 30 years. This might be a long time, but how long are you going to be invested? If you live to age 95 and are in your 40’s or 50’s, 30 years is not that long. Another issue is Ramsey’s buy and hold philosophy. The idea is great on the surface, but when a year like 2008 strikes many individual investors, without a good financial support system, are going to sell. If you get burnt, you first want to stop the pain (sell low) and when you go back, if at all, it will be when you feel ready (buy high). Buy and hold is the correct advice, but when you call the broker for reassurance there is always the potential of him or her selling you another fund at 5% commission to help “make you feel better,” while padding his or her pockets with more of your money. This is where a fee-only advisor earns their fee. By keeping the client focused long term, buy high and sell low tendencies can be eliminated, increasing the client’s rate of return. Ramsey also recommends that you not own bonds. He states “bonds are mistakenly believed to be safe.” While it is true – not all bonds are safe – there is a good case to be made for adding the right bonds to a portfolio to lower volatility. Bonds in a portfolio help keep you from hitting the panic button when it feels like the stock market is falling into oblivion. A fee-only advisor can help choose the right bonds for the portfolio. Ramsey also wants his followers to stay away from Exchange Traded Funds (ETFs). ETFs, if used properly are more tax efficient than any mutual fund, held outside retirement accounts, are more liquid and offer cheaper fees. There are good ETFs and bad ETFs, and I think Ramsey has thrown the baby out with the bath water with this advice. Perhaps it is because his network of advisors would not receive a commission or trailing fee if ETFs were used. What should Ramsey do? If Ramsey and his network of brokers wanted to truly work in the best interest of his radio and print flock, I propose that he endorse a network of fee-only advisors, simply being paid by the hour. These advisors would help create portfolios for the Ramsey following at a fraction of the cost of his commission advisors, all while giving unbiased investment advice. In the end, Ramsey’s math does not add up and the investor loses. Ramsey, who tweeted that he was the “big dog on the porch” in a recent tweet with fee-only advisor Carl Richards, could use his status to help make all advisors work in the best interest of their clients, as is being discussed at the SEC in 2015. Instead, he sits in the pockets or every big insurance company on Wall Street who wants to maintain the current system of taking from Main Street to pad the profits of Wall Street.

SPDR S&P 500 ETF : Let’s Analyze It Using Our Scorecard System

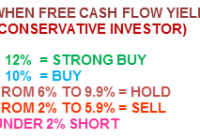
Summary Analysis of the components of the SPDR S&P 500 ETF (SPY) using my Scorecard System. Specifically written to assist those Seeking Alpha readers who are using my free cash flow system. Part II concentrated on “Main Street” while Part I in the series concentrated on “Wall Street” and this final Part III will combine everything into one final result. Back in late December I introduced my free cash flow “Scorecard” system here on Seeking Alpha, through a series of articles that you can view by going to my SA profile . My purpose in doing so was to try and teach as many investors as I could on how to do this simple analysis on their own as I believe in the following: “Give a person a fish and you feed them for a day, Teach a person to fish and you feed them for life” I have been very pleased with the positive feedback that I have received so far, but included in that feedback were many requests by those using my system, to see if they did their analysis correctly or not. Since the rate of these requests have been increasing with every new article I write, I have decided to start a new series of articles here on Seeking Alpha analyzing the SPDR S&P 500 ETF (NYSEARCA: SPY ), where I will analyze each of its components individually. That way those of you using my system will have something like a “teacher’s edition” that will give you all the correct calculations for each component. Obviously I couldn’t include the results for all my ratios in one article, so I will did a series of articles, (where this is the final part) where each ratio’s results for the SPDR S&P 500 ETF will have its own article devoted to it. Hopefully these articles can be used as reference guides that everyone can use over and over again, whenever the need arises. Having said that, I would suggest that everyone first read Part I by going HERE . There you will find the data on my “Free Cash Flow Yield” ratio which is one of three parts that I use it tabulating my final “Scorecard”. While free cash flow yield is a Wall Street ratio (Valuation Ratio), I also wrote an article that concentrated on my “CapFlow” and “FROIC” Ratios, which are Main Street ratios, which you can read by going HERE . In this article I will generate my Scorecard results for each component and basically combine all three ratio results to generate one final result. Once completed, my Scorecard should give everyone a clearer understanding on how accurate the valuation is that Wall Street has assigned each company relative to its actual Main Street performance. Before we show you the final results of my Scorecard, here is brief introduction to how it works: Scorecard The Scorecard is the final score for any company under analysis and this is done by combining the three ratio (listed below) final results into one analysis, we grade each company with either a passing score of 1 or a failing score of 0 per ratio where a perfect final score per stock would be a 3. The ideal CapFlow results are anything less than 33%. The ideal FROIC score is any result above 20%. The ideal Free Cash Flow Yield is anything over 10%. So in analyzing Apple (NASDAQ: AAPL ) for example, we get for TTM (trailing twelve months). For the conservative investor: CAPFLOW = 16% PASSED FROIC = 34% PASSED FREE CASH FLOW YIELD = 7.6% FAILED SCORECARD SCORE = 2 (Out of possible 3) For the aggressive or “Buy & Hold” investor, we get a Scorecard score of 3 as Apple’s 7.6% free cash flow yield would be classified as a buy. These are the parameters for the Free Cash Flow Yield. It is important before preceding to determine what kind of investor you are as determined by the amount of risk you are willing to take. Then once you have done that, then pick the parameter list below that fits your risk tolerance. So without further ado here are the final Scorecard results for the components that make up the SPDR S&P 500 ETF : What my Scorecard also achieves, besides telling you which individual stocks are attractive and which are not, is that it also allows you in “one shot” to see how overvalued or attractively valued the stock market is as a whole. For example, for the conservative investor now is the time to be extremely cautious as only these five stocks came in with a perfect score of “3” Affiliated Managers Group (NYSE: AMG ) Aflac (NYSE: AFL ) General Dynamics (NYSE: GD ) LyondellBasell Industries (NYSE: LYB ) Principal Financial (NYSE: PFG ) As you can see I only found 5 bargains out of 500 for the conservative low risk investor and that comes out to just 1% of the total universe being bargains! As for the aggressive investor, who is willing to take on more risk, we have only 30 stocks that are considered higher risk bargains. That comes out to only 6% being attractive and 94% being holds or sells. So as you can see as a portfolio manager I have to work extremely hard just to find one needle in the haystack, while in March 2009 there were probably 250 bargains for the conservative investor at that time. Thus this data clearly shows that we are at the opposite extreme of where we were in 2009 and are at an extremely overvalued level. Here is the same analysis using the Dow Jones Index where I actually analyzed that index for 2001, 2009 and 2015. You can view those results by going HERE . Here are also the 30 names that passed the “3” test for the more aggressive/buy & hold investor, from the list above. Affiliated Managers Group Aflac General Dynamics LyondellBasell Industries Principal Financial Accenture (NYSE: ACN ) Apple Bed Bath & Beyond (NASDAQ: BBBY ) Citrix Systems (NASDAQ: CTXS ) Coach (NYSE: COH ) CR Bard (NYSE: BCR ) Delta Air Lines (NYSE: DAL ) Dun & Bradstreet (NYSE: DNB ) Edwards Lifesciences (NYSE: EW ) Electronic Arts (NASDAQ: EA ) Expedia (NASDAQ: EXPE ) Fossil Group (NASDAQ: FOSL ) H&R Block (NYSE: HRB ) IBM (NYSE: IBM ) Lockheed Martin (NYSE: LMT ) Microsoft (NASDAQ: MSFT ) NetApp (NASDAQ: NTAP ) PetSmart (NASDAQ: PETM ) Qualcomm (NASDAQ: QCOM ) Rockwell Automation (NYSE: ROK ) Scripps Networks (NYSE: SNI ) Seagate Technology (NASDAQ: STX ) Teradata (NYSE: TDC ) VeriSign (NASDAQ: VRSN ) Western Digital (NASDAQ: WDC ) In getting back to the table the “TOTALS” you see at the end are the sum of each ratio divided by 500. The totals for both Scorecards are out of 1500 (1 point for each ratio result) as a perfect score were every stock would be a bargain. Therefore the conservative scorecard result is 384/1500 or 25.6% out of 100% and the more aggressive/buy & hold scorecard came in at 488/1500 or 32.5% out of 100%. Both clearly are not inspiring and could be a clear sign that the markets are ready for serious correction going forward. Always remember that the results shown above should not be considered investment advice, but just the results of the ratios. The system outlined in this article is just meant to be used as reference material to be included as just “one” part of everyone’s own due diligence. So in other words, don’t make investment decisions based on just my Scorecard results, but incorporate them as part of your own due diligence.