Tag Archives: facebook

This Is What Happens When The Fed Tries To Leave ‘QE’

The S&P 500 moved from 857.39 when QE1 was first announced to 1982.30 when QE3/QE4 ran its course for an approximate gain of 131%. Perhaps it should come as no surprise that – since October 29th of last year when QE3/QE4 ended – the S&P 500 has garnered a modest 2.7%. Energy, materials, industrials, transportation – decliners have been pressuring advancers since the beginning of May. From my vantage point, the evidence that has been building up for several months has strongly favored reducing the risk of loss in one’s portfolio. Back on October 29, 2014, the Federal Reserve ended its largest round of quantitative easing (QE3/QE4). The unconventional policy of buying market-based assets with electronically created credits (dollars) first began in late November of 2008. Since that time, $3.75 trillion in stimulus forced interest rates downward and sent stock prices soaring. The S&P 500 moved from 857.39 when QE1 was first announced to 1982.30 when QE3/QE4 ran its course for an approximate gain of 131%. Equally intriguing, when the Fed backed away from its asset purchasing rate manipulation, stocks struggled mightily. The S&P 500 fell 16% in a sharp pullback shortly after the end of QE1. What’s more, in the period between QE1 and QE2, stocks essentially experienced flat returns. The same phenomenon occurred shortly after the end of QE2. The S&P 500 fell 19.4% in a bearish sell-off. It wasn’t until the Fed began selling short-term Treasury bonds and buying longer-term Treasury bonds that investors regained confidence in late 2011. Moreover, the period between the end of QE2 and the start of QE3/QE4 yielded very little in the way of gains. Perhaps it should come as no surprise that – since October 29th of last year when QE3/QE4 ended – the S&P 500 has garnered a modest 2.7%. Other areas of the U.S. stock market have had less success. The iShares Transportation Average ETF (NYSEARCA: IYT ) has already corrected nearly 11% since the end of QE3/QE4, while the Dow Jones Industrials is in the same place that it started. As I described in Tuesday’s ‘Market Top? 15 Warning Signs’ – as I discussed in numerous articles throughout May, June and July – extremely overvalued stocks and deteriorating stock market breadth create an unsavory concoction. Mix in a central bank that expresses a desire to hike borrowing costs when the global economy is decelerating, commodities are plummeting and credit spreads are widening, and even the mightiest success stories begin to get victimized. Time and again, history has shown that when more and more sectors are falling apart, the pressure on the remaining sectors becomes overwhelming. Energy, materials, industrials, transportation – decliners have been pressuring advancers since the beginning of May. Granted, one may wish to pay a premium price for earnings growth in Disney (NYSE: DIS ), Facebook (NASDAQ: FB ) and Netflix (NASDAQ: NFLX ). On the other hand, when the number of advancing stocks participating in the bull market continues to diminish (relative to decliners), even the most popular momentum stocks eventually witness a mad dash for the exits. I am not suggesting that investors should abandon all of their risk assets. On the flip side, history tends to validate the adage, “the further they climb, the harder they fall.” The media can try to pin all of the blame on China’s turmoil. As a catalyst, sure. Yet S&P 500 corporations with valuations at the 2nd highest levels in history are struggling to report earnings growth. Worse yet, revenues have declined for two consecutive quarters. If fundamentals matter, shouldn’t one expect some reversion to average price-to-sales ratios and/or average market cap-to-GDP ratios? And then there’s the global economy. Currency devaluation throughout Asia, Latin America and Europe certainly haven’t helped the 50% of profits that are generated by S&P 500 corporations abroad. Worse yet, the London Interbank Offered Rate, or LIBOR, has been rising for the better part of the last 12 months. Might this suggest that banks in the UK (as well as banks that use LIBOR for mortgages) are growing concerned about lending to one another? Does it hint that the world’s reliance on central banks to keep rates unbelievably low is now in danger of creating another credit crisis? From my vantage point, the evidence that has been building up for several months has strongly favored reducing the risk of loss in one’s portfolio. Should you run for the hills? No. Yet I continue to favor large-caps over small-caps, domestic over foreign. I continue to favor treasuries and investment grade over higher yielding bonds. Most importantly, I have been systematically raising the cash level in client accounts for months. 20%, 25%, 30%, depending on client risk tolerance. Having that cash gives my clients the opportunity to buy high quality stocks at more attractive prices when a pullback, 10%-plus correction, or 20%-plus bear shows signs of abating. Specifically, when market internals/breadth as well as valuations improve, cash will be redeployed. Disclosure: Gary Gordon, MS, CFP is the president of Pacific Park Financial, Inc., a Registered Investment Adviser with the SEC. Gary Gordon, Pacific Park Financial, Inc, and/or its clients may hold positions in the ETFs, mutual funds, and/or any investment asset mentioned above. The commentary does not constitute individualized investment advice. The opinions offered herein are not personalized recommendations to buy, sell or hold securities. At times, issuers of exchange-traded products compensate Pacific Park Financial, Inc. or its subsidiaries for advertising at the ETF Expert web site. ETF Expert content is created independently of any advertising relationships.
How I Diversify And Hedge My Portfolio For Market Volatility

Wide diversification and a ‘buy and hold’ strategy are not necessary for success. In fact, there are much better ways to hedge the market, capitalize on upside, and protect yourself from downside. Here is how I diversify my portfolio. Wide diversification is only required when investors do not understand what they are doing.” – Warren Buffett Every couple weeks I list my portfolio along with top-rated stocks to members of Tipping the Scale. I do this because my holdings often change depending on stock gains, valuation, and when new opportunities arise. Soon after my last update, a person noted that I did not own any materials, utilities, and was very light on industrial stocks and ETFs. He continued that for a portfolio of my size, he was surprised I did not prioritize “diversification”. My response is that I do diversify, just differently, and that my intention is not to track the market, but to rather beat the market. With well over a decade of consistency, my bottom line approach has not changed much, having worked very well in all markets. Here’s what I do. Rather than prioritizing industries and sectors of the market to achieve diversification, I diversify by purpose. Each holding in my portfolio fits into one of five categories, my sectors if you will, and thereby having a purpose. That category dictates management style, selection, and activity. Here are the five categories and the weight that each has in my portfolio Category Weight Top rated stocks 35% Dividend & Income Stocks 30% Deep Value 10% Growth & Momentum 5% Cash 20% Top-rated stocks are those that score in the upper echelon of companies covered in Tipping The Scale. Typically these are stock that score 88 or higher, meaning the company had to score relatively high in all 10 categories that TTS tracks. These include business growth, macro outlook, profitability, management vision, valuation, etc. Due to such a high rating, my theory is that “top-rated stocks” are worth holding through volatility, and should not be sold, only acquired in periods of loss until the company’s rating starts to decline. In the first three months of TTS, top-rated stocks (seven stocks with a score better than 90) traded higher by more than 9% versus a loss of 1% in the S&P 500. Therefore, these stocks tend to perform well both in short and long term, which is why they are such a staple in my portfolio. For investors considering my portfolio strategy, 35% of your holdings would be allocated to those stocks where you have the most confidence, and are the best of the best, however it is that you determine “the best”. Dividend And Income stocks provide some balance to my portfolio, as these are typically low beta, safe investments. Seeing as how 40 of the potential 100 points for TTS stocks are tied to business growth, macro outlook, and the amount of short and long-term upside in a stock, large companies with high dividends don’t typically rank as “top rated stocks”. Therefore, I hedge those types of investments with stocks that don’t necessarily have tons of upside or growth (i.e. AT&T (NYSE: T ) or Corning (NYSE: GLW )) but have high yields. These are companies that would rank high in other areas, but just don’t have the growth upside of a top-rated stock. Furthermore, this is where I put REITs like the Vanguard REIT Index Fund (NYSEARCA: VNQ ) and ETFs that have high yields. The key with the dividend and income section is to invest in entities that pay a high yield. The average yield of my holdings that fit into this section is 4.6%. With 30% of my portfolio allocated to dividend and income, that 4.6% yield for 30% of my portfolio translates to a 1.4% yield for the entire portfolio. Not to mention, often times a company that pays a dividend will fit into another category, thereby not considered part of the dividend & income section. A good example is Apple (NASDAQ: AAPL ) and Schlumberger (NYSE: SLB ), which fit into the top rated and deep value sections of the portfolio, respectively. All in all, the yield of my total portfolio is 1.8%, just about equal to the SPDR S&P 500 ETF Trust (NYSEARCA: SPY ). That gives me a downside cushion while also hedging my top rated holdings. With that said, the top rated stocks and dividend & income sections serve as a natural hedge against the other, limiting downside risk in the face of a market correction. The Deep Value and Growth And Momentum sections tend to do the same. Albeit, I don’t worry about how many holdings in each sector are in my portfolio, but by allocating my portfolio based on goals, you end up owning stakes in most industries. For example, energy and financial stocks trade at the lowest multiples and are mostly cheap because of macro-related factors, whether it be oil prices or low interest rates. This gives investors an opportunity to cherry pick top companies in those respective industries, those that have fallen below their worth because of macro-related concerns. My belief is that once those macro-related concerns stabilize, those top companies like Schlumberger, EOG Resources, JPMorgan (NYSE: JPM ), and Goldman Sachs (NYSE: GS ) will be the ones to outperform their peers. However, if those macro factors don’t improve, then not much of your portfolio is tied to such stocks. That said, there is certainly no valuation considerations for stocks included in my growth and momentum section. This is where I own companies like FireEye (NASDAQ: FEYE ), Facebook (NASDAQ: FB ), or speculative biotechnology companies. As explained in a recent blog , this is where I trade stocks based on their score in TTS. This is where I buy momentum stocks when volatility makes them cheap, and then sell when that price gets too high. Notably, if the market turns for the worse, these are usually the first stocks to go lower, and that’s why when owning such stocks it is good to keep a close eye and set stern stop-loss and limit orders. Finally, I keep a cash stake that equates to 20% of my total portfolio, which too fluctuates depending on the performance of the market. Believe it or not, cash is where investors can really hedge the performance of the market, and use volatility to their advantage. Below is a chart that I follow as a way to determine the size of my cash stake. Cash as percentage of portfolio S&P 500 performance 15% bull market 20% 2% to 5% off highs 25% 5% to 8% off highs 30% 9% to 12% off highs 35% 13% to 30% off highs 50% 31% or more off highs We are coming off a five year bull market that has seen very little economic growth, one that I fear has been driven by lower interest rates and multiple expansion. I have said on many occasions that I expect a correction. The problem is that there’s no way to know when that correction will come or how bad it will be. So, when the market starts to dip, I start cutting my growth and momentum stocks. If it keeps falling, I will trim value stocks that are hurt by macro conditions. Finally, if the market keeps going lower, surpassing that 30% from market high levels, I will start cutting dividend stocks. However, unless something changes the outlook for those high rated stocks, I will not sell, not until my price target is reached. With that said, this is a hedge that I have found to be very useful over the years. For one, both times that the market has exceeded a loss of 30% off its high since the year 2000, it continued to dip significantly lower. Therefore, I protect myself from future losses, and by quickly increasing my cash position and removing high beta stocks, while retaining low beta stocks (dividend), my portfolio tends to outperform the market. Then, by decreasing cash and increasing my stake in high beta momentum stocks, my gains tend to outperform the broader market as it recovers. However, the final and most important piece of the puzzle are those high rated stocks, because as I already explained, those stocks consistently outperform the market due to having the total package in those 10 essential categories. All things considered, the buy-and-hold, complete diversification strategy by owning all industries of the market is not a bad way to structure a portfolio, but I don’t think it is the best way, and neither does Warren Buffett. Instead, it is best to determine what you want from a portfolio, and then create it from those goals. Over the years, as my net worth has grown larger, I’ll be the first to say that my appetite for risk has diminished, and where I used to own more momentum stocks, I have since found high yield to be most important. However, the one thing that has not changed is my desire to own as many high quality companies as possible. In any market, those are the ones that thrive, and that’s why I would tell anyone to diversify by owning what’s best, and not to own a little piece of everything. Disclosure: I am/we are long AAPL, GS, T, JPM, SLB, GLW. (More…) I wrote this article myself, and it expresses my own opinions. I am not receiving compensation for it (other than from Seeking Alpha). I have no business relationship with any company whose stock is mentioned in this article.

Adams Diversified Equity: A 6-Month Checkup

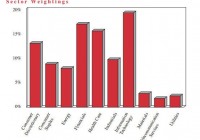
Recently renamed ADX turned in a good first half. Health care and consumer saw new additions. Overall, new management is proving solid so far. Adams Diversified Equity Fund (NYSE: ADX ), formerly known as Adams Express, is one of the oldest closed-end funds, or CEFs, around. That said, a management change in early 2013 meant the potential for big shifts at the fund — and a risk that performance might falter. So far, however, investors should be reasonably pleased with how CEO Mark Stoeckle has been running things. And the first half of 2015 bears that out. Things change… Adams changed its management at the start of 2013, which meant that 2013 was a transition year. Notably, portfolio turnover that year basically doubled compared to historical levels. That said, 2014 saw that number come back down to more-normal levels and that trend has continued so far in 2015. Performance-wise, the fund’s total return in 2013 wasn’t great on a relative basis. Based on net asset value, or NAV, and including reinvested distributions, the fund trailed that S&P by around 3.5 percentage points that year. That said, the fund’s return was 28% in 2013, which is a hard number to complain about. The next year, 2014, wasn’t as good on an absolute basis, but the fund closed the gap with the S&P, with ADX lagging the index by roughly half a percentage point. That’s a much better relative showing. And according to the fund, through the first six months of this year ADX’s return of 2.7% compared favorably to the S&P’s gain of 1.2%. Is this a harbinger of outperformance to come? Maybe, maybe not. As we all know, past returns don’t predict future results. But what it shows is that under new management, ADX hasn’t fallen off a cliff. That said, Stoeckle has only been operating Adams in a generally up market, so he still needs to be tested by a downturn. But investors should be reasonably pleased with the fund’s showing over the last two and half years or so that he’s been running things. New holdings With a fund like ADX, things aren’t usually all that exciting at the portfolio level. This is why the portfolio restructuring in 2013 that doubled the turnover rate was so notable. But with things back to normal, change at the fund is more incremental. For example , Stoeckle noted in the fund’s quarterly report that he added to the fund’s positions in Facebook and Comcast, and added new positions in Valeant and Edwards Lifesciences in health care and Kroger and Spectrum Brands in the consumer space. These aren’t huge shifts or changes, and keep with broader themes already present in the fund. Comcast, around 2.2% of assets at the midpoint of the year, is a top-10 holding, the others are not. That said, while the fund is fairly well diversified, there is one concerning holding — Apple. That stock, the fund’s largest holding, accounted for over 5% of assets at the end of June. That’s a fairly hefty exposure to one company and as the recent Apple sell-off attests, is worth keeping in the back of your mind. Still, at 5% of assets, an Apple sell-off would hurt the fund but alone shouldn’t be enough to cause major damage. The fund sold a number of holding in the period, too. The list includes Abbvie, General Mills, Hershey, Micron Technology, and Unilever. Several positions were trimmed, as well, including Aetna, Coca-Cola, Gilead Sciences, Intel, and Disney. Bouncing those names against the additions, you can see the big picture didn’t alter all that much. Looking at the fund from that greater distance, technology, finance, and health care were the three largest sectors at the end of June, making up roughly half the fund. The consumer sector was number four. Utilities, telecom, and basic materials pulled up the rear, representing the fund’s smallest sector weightings. Dividends and more So the first half was relatively uneventful for the fund. It performed well and aside from Apple, which has long been a large holding, there really weren’t any red flags. Moreover, the portfolio changes were largely shifting within the bigger picture. So mostly good news here. Adams also announced another dividend, of $0.05 a share. That’s relatively small, but keeps with the trend of three small quarterly payments and one larger one at the end of the year. The fund’s goal is to distribute 6% of assets on an annual basis. That’s a number that should interest income-oriented investors. There’s no expected change to that, according to Stoeckle. The way in which distributions are paid out, however, isn’t exactly desirable if you are trying to live off of your investment income. So you’ll have to take that into consideration here if you are buying for the distributions. Note, too, that annual distributions will go up and down based on performance since they are a set as a percentage of NAV, not a hard dollar figure. In addition, the fund bought 765,000 of its own shares in the first half at an average discount of just under 14%. That’s roughly where the discount sits today and in line with its average over the past three years. I’d say that’s a reasonable use of cash and helps to support the fund’s NAV over the long term. Remember, that the fund has been in existence since the Great Depression, so this is far from a fly-by-night operation. And as a stand-alone company, there’s no sponsor manipulating things. What you see is what you get at ADX and it’s looking to stay in business for years to come. So while stock buybacks are interesting, they should be seen in light of a longer-term picture — not necessarily as a way to shift market perceptions today. All of that said, ADX often gets chided for being a closet S&P index clone, which isn’t too far off the mark. However, for investors seeking income, the 6% yield target is much better than the yield on the S&P. True, the expense ratio of 0.65% is high relative to an S&P index, but some investors might be willing to make that trade-off. (Note that actual reported expenses this year will be higher because of one-time items related to the termination of a defined benefit retirement plan, which is likely a net positive for the company and its shareholders.) So, in the end, the first half was a good one for Adams. And while it isn’t a perfect investment, it’s a pretty good one if you are looking to outsource some of your investment load. It’s been around for a long, long time and looks like it will continue to be around for a long, long time to come. Disclosure: I/we have no positions in any stocks mentioned, and no plans to initiate any positions within the next 72 hours. (More…) I wrote this article myself, and it expresses my own opinions. I am not receiving compensation for it (other than from Seeking Alpha). I have no business relationship with any company whose stock is mentioned in this article.