Tag Archives: etfs

Making The Patient Sicker

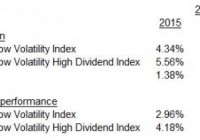
By Craig Lazzara Years ago, I saw a cartoon picturing two Victorian-era doctors discussing a patient. “What did you prescribe for Jones’ rheumatism?” asked the first; the second answered “A cold bath and a brisk walk every morning.” “Good God, man, that will give him pneumonia!” said the first. “I know,” replied the second doctor, “I made my reputation curing that.” Somehow I was reminded of this exchange when I learned from this morning’s news that some institutional investors, smarting from recent losses, are considering increasing their commitment to active equity management. Their operating assumption seems to be that active managers will do a better job of capital preservation in a challenging and volatile market. There’s certainly some plausibility to this argument. It turns out, however, to be another beautiful theory mugged by a gang of facts . The facts come from our periodic SPIVA reports, which compare the results of actively-managed mutual funds against passive benchmarks. Weak markets, it turns out, are no panacea for active managers. In 2008, e.g., 54% of large-cap U.S. funds underperformed the S&P 500. Results were even worse for mid- and small-cap managers (75% and 84% underperformers, respectively). Statistics say, in other words, that moving from passive to active as a way of managing market volatility is likely to make performance worse, not better . Fortunately for anxious investors, passive strategies which focus on the lowest volatility segment of the equity market are most likely to outperform precisely when the market is weakest. Consider, for example, the S&P 500 Low Volatility Index and its cousin, the S&P 500 Low Volatility High Dividend Index: Both of these indices are designed to attenuate the returns of the S&P 500 in both directions; historically, they have both tended to underperform market rallies but outperform when markets are weak. Their reliability as defensive vehicles has far exceeded that of active management. Investors concerned about continuing volatility and market weakness should consider indicizing their defensive strategies. Disclosure: © S&P Dow Jones Indices LLC 2015. Indexology® is a trademark of S&P Dow Jones Indices LLC (SPDJI). S&P® is a trademark of Standard & Poor’s Financial Services LLC and Dow Jones® is a trademark of Dow Jones Trademark Holdings LLC, and those marks have been licensed to S&P DJI. This material is reproduced with the prior written consent of S&P DJI. For more information on S&P DJI and to see our full disclaimer, visit www.spdji.com/terms-of-use .
The New Definition Of Investment Manager Success: How To Tell Who’s Winning

It’s become self-evident recently that peer groups suffer from “loser bias” because the majority of active managers underperform their benchmark. Beating the losers is not a “win.” Peer group comparisons simply don’t work anymore. Beating the benchmark is a good beginning, especially when combined with a statistical test of significance called a “Success Score.”. If intermediaries continue to use peer groups, as is likely the case, investors will continue to be disappointed because they’ll continue to hire losers. In the “good old days,” investment managers had two shots at winning. They could beat their index or they could beat the median manager in their peer group. That peer group thing doesn’t work anymore. Due to the popularity of passive ETFs and the emergence of Robo Advisors, there is only one pertinent yardstick – beating the benchmark. Unfortunately , less than 20% of active managers achieve this measure of success. This active manager failure renders peer groups worse than useless. It is now well-understood that peer groups suffer from “loser bias,” in addition to survivor and classification biases. Loser bias is the reality that more than 80% of the managers in a peer group are losers since they fail to beat their benchmarks. Beating the losers is like winning the prize for best ballerina in Waco. Investors need to demand better. So the new definition of “success” is beating the benchmark, but there’s more to winning than this simple measure. We want to know that success is not just luck, that it is likely to repeat in the future. That’s where statistics and “Success Scores” come in. We call it a “win” if the outperformance of the benchmark is statistically significant. Success Scores are the statistical significance of benchmark outperformance. A facsimile of a peer groups is created by forming all the portfolios that could be formed from the stocks in the index. A ranking against these Success Scores in the top decile is significant at the 90% confidence level – we can be 90% sure that it wasn’t just luck. Success Scores are bias free and available a day or two after quarter end. It’s not enough to beat the benchmark. An investment manager needs to beat his benchmark by a significant amount to be a true winner. Success Scores are especially worthwhile for hedge fund managers since peer groups of hedge funds are just plain silly. The tradition of disappointment in active managers will continue if clients (investors) allow it to continue. Clients deserve better,but they need to know how to get it. Investors need to understand their advisor’s due diligence process and to be concerned if it includes peer group comparisons. In other words, investors should seek out advisors who employee contemporary due diligence tools if they are relying on their advisor to select good investment managers. Here are some facts every investor should know: Based on Dr. William F. Sharpe’s “Arithmetic of Active Management”, 50% of active managres should beat their benchmark. The fact is only 20% beat their benchmark, far below expectations. The search for “alpha” uses regression analysis. “Alpha” is the Greek letter for the intercept. It is well-documented that it takes at least 50 years for a manager with “average” skill to deliver a statistically significant alpha. By contrast, “Success Scores” can provide significance for very short periods, like one year. 70% of managers are active, not passive. Towers Watson, a prestigious investment consulting firm, says this number should be closer to 30%. There are too many active managers. Approximately 40% of funds in a peer group don’t belong because they’re different. This problem is called Classification bias. For hedge fund peer groups, most funds don’t belong because hedge funds are unique, which by definition means without peers. Knowledge is power. Disclosure: I/we have no positions in any stocks mentioned, and no plans to initiate any positions within the next 72 hours. I wrote this article myself, and it expresses my own opinions. I am not receiving compensation for it. I have no business relationship with any company whose stock is mentioned in this article.

Fund Liquidations: TeaLeaf, Fortress, Ramius And Redmont

In this edition of Fund Liquidations, we note four funds that have recently liquidated or filed for liquidation. The four funds cut across four investment categories: Long/short equity, long/short credit, event driven and multi-alternative. TeaLeaf Long/Short Deep Value Fund (MUTF: LEFIX ) Fortress Long/Short Credit Fund (MUTF: LPLIX ) Ramius Event Driven Fund Redmont Resolute Fund (MUTF: RMRGX ) TeaLeaf Long/Short Deep Value Fund In a January 25 filing with the Securities and Exchange Commission (“SEC”), the Board of Trustees of Tea Leaf Management Investment Trust decided to close the TeaLeaf Long/Short Deep Value Fund. The reason cited by the board was its relatively small size. For the year of 2015, the A shares of the fund returned -1.14%, which while not spectacular was still enough to rank the fund in the top half of its category. Nevertheless, the Board decided to terminate the fund, and its shares were entirely liquidated by January 29 – one month shy of the fund’s 3-year anniversary. Fortress Long/Short Credit Fund In a February 12 filing with the SEC, the Fortress Long/Short Credit Fund’s Board of Trustees voted to terminate the fund. This news comes just shortly after reaching the 5-year anniversary of the fund, which was launched in December 2010. Any shareholders who have not sold their shares by March 12 will have them automatically redeemed, according to the filing. The fund’s original Advisor share class returned -4.83% in 2015, ranking in the bottom 10% of its category. The fund is sub-advised by Logan Circle Partners. Ramius Event Driven Fund The Ramius Event Driven Fund’s Board made the decision to terminate the fund on December 28, 2015, just three months after the fund’s second anniversary. Any outstanding shares that hadn’t been redeemed by February 2 were automatically retired, with holdout shareholders receiving their proportion of the fund’s remaining net assets, according to the filing . The fund’s A shares returned -7.68% in 2015, ranking in the bottom 14% of Morningstar’s Long/Short Equity category. Redmont Resolute Fund I The Board of Trustees for the Redmont Resolute Fund I voted to liquidate it on December 17. The fund was launched on December 30, 2011. According to the SEC filing , the liquidation was expected to be completed by January 29. The A-class shares of the Redmont Resolute Fund, a multi-alternative fund, returned +0.15% in 2015, which was enough to rank it in the top 15% of funds in its category. Nevertheless, the fund’s Board determined it was in the best interests of shareholders to liquidate. The fund was advised by Highland Associates and sub-advised by PineBridge Investments. Past performance does not necessarily predict future results. Jason Seagraves contributed to this article.