Tag Archives: etf-monkey

Building The Core With Vanguard: Foreign Stocks

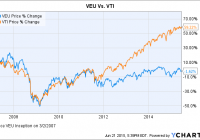
Summary Every ETF investor needs to consider what holdings will form the very core of their portfolio. For the portion relating to foreign stocks, the Vanguard FTSE All-World ex-US ETF is a compelling choice. Also discussed are reasons every investor should consider holding foreign stocks in their portfolio, along with links to additional background reading for those who desire such. For my first articles for Seeking Alpha, I decided to start simple: tackling the question of building a solid core portfolio using ETFs offered by Vanguard Funds. I started with domestic stocks featuring the Vanguard Total Stock Market ETF (NYSEARCA: VTI ), followed by domestic bonds featuring the Vanguard Total Bond Market ETF (NYSEARCA: BND ). As can quickly be discerned, however, both of the above options relate to U.S.-centric investments. For their portfolio to be complete, investors should also seriously consider going beyond the borders of the U.S. and into the world of foreign equities. For your first venture into this brave world, the Vanguard FTSE All-World ex-US ETF (NYSEARCA: VEU ) makes an excellent choice. Why Foreign? Why Now? For an overview of the risks and benefits of investing in foreign stocks, I offer this article from my personal blog. It offers a relatively brief, yet comprehensive overview, supported by links to further reading if desired. Essentially, what you will read there is that foreign stocks offer two potential benefits, growth and diversification . Hopefully, this material will answer that first question, Why Foreign? But what about that second question, Why Now? I hope to write about the concept of rebalancing one’s portfolio in a future article. But for now, let me just say that a key to good portfolio management is to “sell high and buy low;” in other words, to take a certain portion of your investments out of asset classes that have outperformed and put them to work in asset classes that have underperformed. With that in mind, have a look at the graph below. It compares Vanguard’s VTI (Domestic Stocks) with the ETF featured in this article, VEU, since VEU’s inception on March 2, 2007: VEU data by YCharts Do you notice anything interesting about that chart? I thought you might. After a period of relatively similar performance between roughly 2007 and 2012, U.S. stocks have outperformed their foreign brethren by a fairly significant margin. Further, foreign stocks have been roughly flat over the roughly 8-year span covered by the chart, while U.S. stocks have risen almost 60%. Let me be clear, there have doubtless been good reasons for this. While the U.S. economy has struggled, in particular since 2008, other countries have done even worse. Further, I am in no way predicting that foreign stocks will outperform their U.S. brethren moving forward. I don’t have a crystal ball. However, based on an analysis similar to this that I performed approximately two months ago, I decided to lower my personal weighting in U.S. stocks by 2.5% and shift those funds to foreign stocks. Certainly, this is no dramatic move. I simply decided that I wished to take a little from the asset class that had experienced significant gains and move it to the class that had been flat. With that big picture background, let’s now turn to the composition of VEU, as well as the expense ratio. Composition VEU is named well (Vanguard FTSE All-World ex-US ) because, as it happens, that is the name of the index it tracks. As such, VEU offers incredibly broad and diversified foreign exposure. As of the latest factsheet , we find that VEU actually contains a slightly greater number of securities than the index, 2,492 vs. 2,377. Let’s look a little closer. First, here is the fund’s geographic allocation: As you can see, the fund leans heavily toward developed markets such as Europe and the Pacific (Asia). At the same time, it offers reasonable exposure to emerging markets; those whose economies are not as fully developed and therefore offer greater potential for growth, albeit with a greater level of risk. If you back out the 18.8% in emerging markets, you quickly realize that 81.2% of the fund is invested in what are generally considered developed markets. Diving in a little more specifically, here are the Top 10 countries represented in the fund. If you add up the numbers, you will see that these countries comprise 73.4% of the total. Of these, China is the only country included in the Vanguard FTSE Emerging Markets ETF (NYSEARCA: VWO ). Let’s now take a look at one last perspective, the Top 10 holdings: To give you some small sense of the sorts of companies that constitute the largest portions of the fund, here are extremely brief synopses of the Top two; Nestle SA ( OTCPK:NSRGY ) and Novartis AG (NYSE: NVS ): Nestle SA – Nestle is the largest food company in the world , measured by revenues. Encompassing baby food, bottled water, coffee & tea, dairy products, frozen food, pet food, snacks and more. The list of brands is made up of legendary names that you will instantly recognize, and Wikipedia states that 29 of these brands each have annual sales of over $1 billion. The company operates in 197 countries, with factories in 86 countries. Novartis AG – Novartis is the largest pharmaceutical company in the world , measured by revenues. According to its latest annual report , Novartis’ products are available in more than 180 countries worldwide. Its pharmaceuticals arm has 135 projects in development, its subsidiary Alcon is the #1 eye care company worldwide, and its subsidiary Sandoz is the #2 global provider of generic medicines. Looked at from any of these vantage points, I submit that VEU is a wonderful core holding for the foreign, or international, component of your portfolio. Costs and Expenses At 0.14%, VEU’s expense ratio is somewhat higher than that of either VTI or BND, the other two ETFs I have featured. And yet, it too is one of the lowest in the industry. Bear in mind, this is an ETF that is dealing with assets all over the world, across different stock exchanges and the like. To that, of course, you have to add your trading commissions. Vanguard offers its own ETFs commission-free, and TD Ameritrade offers a decent selection of commission-free Vanguard ETFs. Suitability As a core holding, VEU is suitable for all portfolios. While I do believe that all investors should hold at least some portion of their portfolio in foreign stocks, I understand that you must do so at a level at which you are comfortable. Alternatives Another ETF worth considering, particularly if your brokerage offers it commission-free, is the iShares Core MCSI Total International Stock ETF (NYSEARCA: IXUS ). It too sports a very competitive 0.14% expense ratio, and covers basically the same range of countries, including emerging markets, as does VEU. The ETF’s size, as well as its average trading volume, is substantially smaller than VEU, but I do not believe this should be any impediment. As a Fidelity client, I use VEU for my core position and IXUS, which I can trade commission-free, for small incremental investments and/or to adjust portfolio weightings. Editor’s Note: This article discusses one or more securities that do not trade on a major U.S. exchange. Please be aware of the risks associated with these stocks. Disclosure: I am/we are long BND, IXUS, VEU, VTI, VWO. (More…) I wrote this article myself, and it expresses my own opinions. I am not receiving compensation for it (other than from Seeking Alpha). I have no business relationship with any company whose stock is mentioned in this article. Additional disclosure: I am not a registered investment advisor or broker/dealer. Readers are advised that the material contained herein should be used solely for informational purposes, and to consult with their personal tax or financial advisors as to its applicability to their circumstances. Investing involves risk, including the loss of principal.
Building The Core With Vanguard: Domestic Bonds

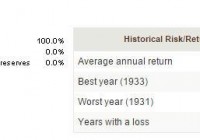
Summary Every ETF investor needs to consider what holdings will form the very core of their portfolio. For the portion relating to domestic bonds, Vanguard’s Total Bond Market ETF is a compelling choice. Also discussed are reasons every investor should consider holding bonds in their portfolio, despite what is often described as a negative current environment. For my first articles for Seeking Alpha, I decided to start simple: tackling the question of building a solid core portfolio using ETFs offered by Vanguard Funds. I started with domestic stocks featuring the Vanguard Total Stock Market ETF (NYSEARCA: VTI ). For this second article, I turn to domestic bonds, and will be featuring the Vanguard Total Bond Market ETF (NYSEARCA: BND ). Bonds? Now? Really…? This might seem an odd time to be featuring bonds. After all, interest rates are at, or close to, historical lows, and common wisdom says they are sure to rise from here. Couldn’t our time be better spent considering other options? I might best answer that question by sharing a personal observation of mine. I tend to have CNBC.com up most of the time as one of the tabs in my browser. Last July (2014), this article titled “Why a $60B fund manager is sitting on 20 percent cash,” featuring BlackRock portfolio manager Dennis Stattman, caught my eye. To explain why he was sitting on 20% cash, the article starts with this attention-grabbing quote from the fund manager: “We don’t like the bond market.” The article goes on to enumerate all of his reasons for that view. But once you got past all that, here was the part that caught my eye. His allocations were 58% in stocks, 23% in bonds , and 19% in cash. My takeaway: Regardless of his stated feelings concerning bonds, that fund manager still had some portion of his portfolio in that asset class. Here is a second point of reference to consider. This resource from Vanguard features historical returns going all the way back to 1926 for various model portfolios, in 10% intervals – ranging all the way from 100% stocks and 0% bonds to the other extreme, 0% stocks and 100% bonds. I selected two of these to look at quickly. The first, a portfolio with 100% stocks, and the second with 60% stocks and 40% bonds: I won’t belabor the points, but a couple of things jump out. On the one hand, the allocation with 40% bonds has an average annual return of 1.4% less than one with 100% stocks. On the other hand, the worst single-year loss is 26.6% as opposed to 43.1%. Depending on a vast array of variables – including the possibility of having to sell at precisely the wrong time due to personal financial circumstances – that could make a big difference. You also derive consistent income from bonds (although, admittedly, not so much at present). This can provide you with funds to reinvest in whatever asset class you wish. Putting it all together, that BlackRock investment manager, at some level, had virtually a 60/40 stock versus bond allocation, but he chose to hold 19% in cash because he “[didn’t] like the bond market.” On a personal note, at the time that this article caught my eye, my personal bond allocation was higher than his, and I actually made an adjustment to bring it more in line with what he was doing. In summary, while you may make various decisions as to their weighting , if you believe in a disciplined portfolio as opposed to market timing, bonds deserve a place. And That Brings Us To BND (Composition) What makes BND such a good ETF to serve as the core for this portion of your portfolio? I believe it boils down to two factors: Outstanding diversification Reasonable duration BND tracks the Barclays U.S. Aggregate Float Adjusted Bond Index . This includes a wide range of government, corporate, and even international dollar-denominated bonds. All are investment-grade (Moody’s rating Baa and above), meaning you are not getting into “junk bond” territory in this particular ETF. I will have more on the risk characteristics below. The fund does not actually own every constituent in the index, but rather samples the index, holding a basket of securities that approximate the full index. The latest datasheet reveals 9,330 bonds in the actual index and 7,364 in the fund itself. As featured in this introductory article , bonds have two main risks: interest rate risk and default risk. Fortunately, the information that you need to evaluate this is provided on the datasheet for any bond ETF you are likely to consider. Here is that information directly from the latest datasheet for BND: (click to enlarge) Interest Rate Risk Let’s start with interest rate risk. When it comes to a bond mutual fund or ETF, the key data point that you need to identify is the fund’s duration . Once you identity this, the general rule is simply to multiply the fund’s duration by the change in rates . In other words, if a fund has a duration of 2 years and there is a 1% upwards move in interest rates, the value of the fund is likely to decrease by 2%. This is intended to be a general guideline as opposed to a precise number, because interest rates may rise or fall by different amounts across various terms. As an example, BND holds bonds with maturities basically ranging from 1 year to 30 years. Still, this serves as a reasonable measure of the amount of risk that you are assuming. With that in mind, note the average duration of 5.6 years displayed on the datasheet for BND. Given that, a 1% increase in interest rates could lead to a temporary loss of 5.6% of principal. I say “temporary” because unless you need to sell, this is only on paper. Remember, bonds have a face value , and this is the amount the bond is ultimately worth on the date of maturity . Also, when evaluating this, perhaps against just leaving your money in cash, consider the current SEC yield (as of 6/9/15) of 2.06%. Default Risk The second main risk with bonds is default risk. This refers to the possibility that the issuer could experience financial difficulties such that they are unable to meet the obligation to pay the face value, to return the original capital invested. Fortunately, ratings agencies rate the creditworthiness of bonds on a descending scale. Even more fortunately, default data is available for each rating category, due to the Municipal Bond Fairness Act of 2008. With that in mind, here is my analysis of this risk for BND: Essentially, I started with the weightings by Moody’s rating as published on the BND datasheet. I then multiplied this by the default risk as identified in the above-linked report, to arrive at a weighted default risk. For BND, my calculation reveals a default risk of .86%. The counterpoint to that, of course, is that lower-rated bond issuers have to offer a higher coupon or interest rate to attract buyers for their bonds. So, funds have to pick a balance of risk/reward. In other words, how far down the scale of default risk are they willing to go in search of higher returns? In the case of BND, the lowest rating currently accepted in the ETF is Baa , which is defined by Moody’s as: “… judged to be medium-grade and subject to moderate credit risk and as such may possess certain speculative characteristics.” You may also note that, cumulatively, 86.2% of the fund’s securities are rated A or higher, with 63.4% in government securities, which are generally considered to be virtually free from default risk. In summary, BND is a solid core holding because of its moderate duration (5.6 years) and credit (or default) risk, due to all holdings being rated Baa and above. Costs and Expenses Similar to that of VTI, BND carries one of the lowest expense ratios in the ETF marketplace, at .07%. To that, of course, you have to add your trading commissions. Vanguard offers its own ETFs commission-free, and TD Ameritrade offers a decent selection of commission-free Vanguard ETFs. Suitability As a core holding, BND is suitable for all portfolios. Alternatives Other ETFs worth considering, particularly if your broker offers them commission-free, are the Schwab U.S. Aggregate Bond ETF (NYSEARCA: SCHZ ) and the iShares Core U.S. Aggregate Bond ETF (NYSEARCA: AGG ). SCHZ features an industry-low .05% expense ratio, and AGG comes in at .08%. However, even if your broker offers commission-free trading on one of these alternatives, I might still hold BND as a core position and use one of the commission-free options to make small incremental purchases, such as monthly or quarterly investments, adjust portfolio weighting and the like. As a Fidelity client, this is how I use BND and AGG (commission-free trading) in my own portfolio. Last-Minute Personal Comments As I complete this article, the interest rate environment continues to be volatile. If you are considering an initial investment in bonds at this point, I might offer two suggestions: Consider establishing your initial position in multiple increments – perhaps 25% at a time. In so doing, if interest rates rise and prices drop, you will gain some proportionate benefit. Of course, this means a commission on each transaction (for most of us), but the benefits may offset this. Consider using another Vanguard ETF, the Vanguard Short-Term Bond ETF (NYSEARCA: BSV ), for some portion of your position. This ETF has a duration of only 2.7 years and a current SEC yield of 1.08%. The trade-off, as you can clearly see, is a little less income in return for less downside risk. Disclosure: The author is long AGG, BND, BSV, VTI. (More…) The author wrote this article themselves, and it expresses their own opinions. The author is not receiving compensation for it (other than from Seeking Alpha). The author has no business relationship with any company whose stock is mentioned in this article. Additional disclosure: I am not a registered investment advisor or broker/dealer. Readers are advised that the material contained herein should be used solely for informational purposes, and to consult with their personal tax or financial advisors as to its applicability to their circumstances. Investing involves risk, including the loss of principal.