Tag Archives: etf-hub

Separation Of Volatile Merchant Business Will Lead American Electric Power To Outperform

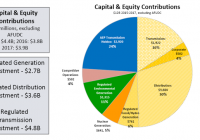
Summary Separation of volatile merchant business will lead to multiple expansion. Higher capex spend to support growth in the weaker environment. Transmission business is expected to be a significant contributor to AEP’s growth in the near future. Healthy balance sheet to trigger M&A opportunities for AEP. Above industry average dividend growth with room for growth may support stock in low power pricing environment. Company description American Electric Power (NYSE: AEP ) is one of the largest electric utilities in the United States (US), delivering electricity to more than 5.3m customers in 11 states. AEP ranks among the nation’s largest generators of electricity, owning nearly 38,000MWs of generating capacity in the US. AEP also owns the nation’s largest electricity transmission system, a more than 40,000-mile network that includes more 765-KV extra-high voltage transmission lines than all other US transmission systems combined. Investment highlights Separation of merchant generation business to improve multiples I expect AEP to sell/spin off its volatile merchant generation business later this year. The company’s management has already confirmed its commitment to make the company a pure regulated utilities business. I see the separation of merchant generation business as a positive catalyst in two ways: 1) AEP as a pure regulated utilities company commands higher multiple and 2) the current stock price doesn’t reflect the merchant generation business. At current levels, AEP trades in line with Duke Energy Corporation (NYSE: DUK ) (15.5x FY15 EPS) excluding any value for its merchant generation business (DUK has already sold its merchant generation business to Dynergy for $2.8bn). Unlike DUK, AEP has no exposure to international risk so commands higher multiple. High capex to support growth Over the next 3 years, AEP plans to invest $12bn (96% to regulated businesses), with nearly $5bn in transmission, $3.6bn in regulated distribution, and $2.7bn into its regulated generation fleet. This drives a 6.6% rate base CAGR across the regulated businesses (including transmission) for 2015-2017. The rate base growth combined with cost cutting measures will definitely help the company reach the target EPS growth of 4%-6% annually. AEP’s future capex plan: (click to enlarge) Source: June 2015 Investor presentation of AEP Transmission business to be a significant contributor to growth I believe the company’s 4%-6% EPS growth rate target is quite achievable and the transmission business is going to be the main contributor to growth, providing $0.15/yr of EPS growth through 2018. With management focused on capital allocation for its businesses, i expect transmission to get the incremental investment from any sale proceeds (sale proceeds from merchant business). AEP’s Transmission Business revenue growth estimate: (click to enlarge) Source: June 2015 Investor presentation of AEP Strong balance sheet AEP is safely levered at present, given regulatory requirements at most of its utility subsidiaries and covenants that require AEP to maintain debt/total capitalization at a level that does not exceed 67.5%. Going forward, i expect the company to remain in safer zone due to stable cash flows from the regulated business. Total debt/capital was 54.4% as of year-end 2014 and i expect it to remain relatively constant going forward despite high investment plans. In addition, AEP has ample liquidity with $163m of cash and $3.5bn of borrowing capacity under its credit facility commitments as of year-end 2014. I view AEP’s dividend as safe and expect the dividend payout ratio to remain at 60%-70%. Source: June 2015 Investor presentation of AEP Experienced management Nick Akins, the sixth CEO in AEP’s 100-year history, became the CEO in 2011. Before his promotion, Mr. Akins served as the executive VP of AEP’s generation unit. He has also led the company’s Southwestern Electric Power unit and was vice president of energy marketing services in his 30 years with the company. Brian Tierney, the executive VP and CFO, has been with AEP since 1998. The experienced management will definitely focus on growing regulated business post separation from volatile merchant business. Strong dividend growth During the 12 months ending 3/31/2015, AEP paid dividends totaling $2.09/share. Since the stock is currently trading at $54.23, this implies a dividend yield of 3.9% (higher than NextEra Energy Inc , AES Corp , NRG Energy, Inc., which have a current dividend yield between 2.3% and 2.9%). AEP has increased its dividend during each of the past 5 years (in 2009, the dividends were $1.64/share). The company has a payout ratio of 60.1% which is expected to reach 70% going forward. AEP’s dividend history and estimate Source: June 2015 Investor presentation of AEP Valuation My price target of $61.26 for AEP is based on a 3.2% premium to the industry target average P/E multiple of 15.5x on 2016 EPS estimate of $3.60. I assign the premium to reflect an improved regulatory environment in most of AEP’s service areas, a visible long-term earnings growth profile in its transmission segment, expected sale of merchant generation business , as well as benefit from PJM’s Capacity Performance proposal. I recommend investors to take position in AEP at current level of $54.23 to get a return of 16.7% (13% price appreciation+3.7% of dividend yield) in one year. AEP’s Regulated Business FY16 Adj EPS P/E multiple Price/share Utilities $2.82 15.8x $44.42 Transmission $0.74 16.8x $12.40 Other $0.04 15.8x $0.63 Total Equity/share $3.60 16.0x $57.44 AEP’s Competitive Gen. Business FY16 Adj EBITDA, $m EV/EBITDA Multiple   Generation co. 360 8.0x 2,880 Debt, $m     1,006 Equity value, $m     1,874 Number of shares, m     490 Equity/share     $3.82         Total Equity/share     $61.26 Current trading price     $54.23 Upside     13.0% Disclosure: I/we have no positions in any stocks mentioned, and no plans to initiate any positions within the next 72 hours. (More…) I wrote this article myself, and it expresses my own opinions. I am not receiving compensation for it (other than from Seeking Alpha). I have no business relationship with any company whose stock is mentioned in this article.

How To Select Funds That Fit

By Detlef Glow Since my colleague Jake Moeller, Lipper’s Head of Research for the U.K. & Ireland, wrote in his last Monday Morning Memo about the reasons an investor might sell a fund , I thought it would be worthwhile to write about the initial fund selection. To find a suitable fund it is necessary that the purpose for which the fund is being bought is clearly defined and that investors know their preferred performance profile. Quantitative Research Once the decision to invest in a given asset type or sector has been made, investors have to find the fund(s) that best suit best their needs. Since in some sectors there are hundreds of funds available to investors, it is necessary to narrow the investment universe by using a quantitative research process to evaluate fund performance. Fund Classification To evaluate the performance of a mutual fund an investor must compare the performance of the fund to the performance of the appropriate market and other funds with the same or similar investment objectives. This means an investor needs to compare apples to apples-or even better, green apples with green apples and red apples with red ones-to employ a proper quantitative screening process. Even though this sounds very simple, it is a rather difficult task , since investors need to take into account that funds with the same investment objective might use different techniques (such as hedging strategies) to achieve their goals. To find a proper classification becomes even harder, when one is looking at alternative UCITS or multi-asset funds. These funds might have the same investment objective but employ totally different sources to generate returns, meaning that the funds might contain totally different risk factors. In this regard, it is important that the investor not only looks at the asset type and investment objective when he tries to classify a fund, he also needs to look at the performance and risk drivers within the portfolio. The fund prospectus is only a starting point for the fund classification, since the prospectus gives the investor only a general idea of what the fund manager can or can’t do to achieve particular goals. The second step must be to view a detailed presentation, since that is the only way to understand what the fund manager is doing, especially in regard to rather complex products. In addition, one needs to monitor the holdings of the fund to see if there is any style drift and/or change of investment focus within the portfolio. Performance Measurement Even though past performance is no guarantee of future performance, past performance is the only source telling an investor how a fund has behaved in different market environments. Past performance is the only source for evaluating the risk/return profile of a fund. It is necessary that the investor use a period with enough data points to show statistically relevant results. A number of investors prefer monthly data for a three- to five-year period, i.e., 36 to 60 data points, to evaluate the performance of a fund. Even though it seems this number of data points is rather small, this period might be more relevant to evaluate the performance of a fund than longer periods; the fund manager or parts of the process might change during longer periods, which would falsify the results of the quantitative research. To evaluate the performance of a fund in comparison to the underlying market and its peers, it is necessary to analyze a number of non-overlapping periods in both bull and bear markets. Only in this way can the length and the magnitude of an out- or underperformance in the given market environment be measured to gain an understanding of the performance profile of a fund during different phases of a market cycle. In addition to the “plain-vanilla” evaluation of performance, some investors also use risk-adjusted ratios such as the information or Sharpe ratio to assess a fund. Pitfalls of Ratios If an investor uses risk-adjusted ratios in addition to plain-vanilla performance measures, the investor needs to understand in detail the formula behind the ratio and to ensure that the employed ratio works in all market conditions. One example is the often-quoted Sharpe ratio. Professional investors know the weaknesses of this ratio in negative-performance environments and would rather use an alternative measure such as the Israelsen ratio to determine the risk-adjusted performance of a fund. Since the Sharpe ratio is often used by the media or on Internet platforms, private investors and their advisors are often unaware that they shouldn’t use the ratio in negative-performance environments. Fund Ratings Some investors try to take a shortcut in the quantitative research process by using quantitative fund ratings from independent rating providers, since these ratings are often available free of charge. But this is not the purpose of the ratings. Any quantitative rating is a measure that should give the investor a hint of which funds are the best under the constraints of the methodology used to evaluate the funds in a given peer group. The measures employed in the given methodology might or might not suit the needs of the investor. In this regard, an investor must have a detailed understanding of the measures used in any given fund rating in order to use the rating in a fund selection process, even as a supplement to an individual fund assessment process. From my point of view, a fund rating or even a fund award should be used along with other quantitative measures, but it should never be used as the only criterion to select a fund; normally, no fund-rating methodology completely meets the needs of an individual investor. After the quantitative assessment of a given peer group the investor needs to verify the results and analyze the most suitable funds in more detail to find the fund that best suits a particular purpose. This second step in the fund research process is the qualitative research. Qualitative Research The qualitative research process begins with the fund prospectus, since the prospectus can give the investor detailed information on which derivatives or security lending strategies a fund manager can employ to enhance the performance of the fund. Because of the language used in the standard fund prospectus, it is often difficult to extract this information. The next step in the process is to send a questionnaire, the so-called request for proposal (RFP), to the asset management company to gain more detailed insight into the wider fund management process. The questionnaire should not only contain questions on staff turnover, changes in the management style, or the management and research process, it might also contain questions on the company’s share- and stakeholder structure. One important point that should be covered in the questionnaire is the risk management process employed by the asset manager, since that process might be the key to achieving the risk targets of the fund and/or to keep the fund in line with the expected general risk profile. The RFP might also contain questions about the general policies of the asset manager, such as exercising shareholder voting rights , etc. This approach also applies to investors who favor passive products, since the investor needs to understand in detail the methodology used to determine the index constituents and their weightings within the index, as well as the general policy of the fund with regard to the use of derivatives and security lending strategies. To complete the qualitative assessment the investor needs to interview the fund manager. While the first contact should be in person, updates can be done over the phone. The first interview can be done at the investor’s office or as an onsite visit to the fund by the investor. Even though it is more convenient to have the fund manager go to the investor’s office, I personally prefer to make onsite visits, since they give the opportunity to speak to other key staff such as analysts and the risk manager to gain even more detailed insight on the management and research process and to validate the answers given in the RFP. By the way, it can be great fun to ask the fund manager during a one-on-one interview the same questions as in the RFP, since the fund manager might give different answers to the same questions. With regard to a deeper understanding of what is going on in the portfolio, it is worthwhile to review the holdings of the fund and to challenge the fund manager with questions on holdings that do not look suitable for a particular investment approach. Since the whole process is done to understand in detail what a fund manager is doing to outperform the market and his peers as well as to get an idea of when a fund is likely to out- or underperform a particular management approach, investors need to develop their own standards for quantitative and qualitative research. From my point of view, the quantitative and qualitative fund research goes hand in hand for fund selection, since neither one can answer all the questions on its own. But in conjunction the two approaches can deliver a very clear picture of whether a fund is suitable for a given investor. Investors looking at the same performance numbers might come to the same conclusion regarding the quantitative research, but since qualitative research is driven individually according to specific requirements, the results of this process can differ widely between investors. The views expressed are the views of the author, not necessarily those of Thomson Reuters.

Calpine Corporation’s Price Decline Is Unwarranted

Summary The company’s long-term story remains unchanged and highly favorable. The recent sell-off likely the result of sector rotation out of utilities. I increased my exposure to the shares by 50%. Calpine Corporation (NYSE: CPN ) shares have gotten pummeled in recent months and now sit at 52 week lows near $17.50/share. Shares are down significantly since I first recommended the company on Seeking Alpha back in February of 2015 , but I still maintain a long-term bullish outlook. This is one company that I agree with sell-side analysts on and I’ve been vigorously beating the drum in favor of. In my opinion, there isn’t a company better positioned for macro trends in United States energy production over the next ten-twenty years than Calpine. This is a shame as retail investors have shunned the company, with the almost all of the shares held by insiders or institutions. This is woeful compared to peers and I think retail investors are turning a blind eye to the company’s prospects for capital appreciation. The lack of a dividend, as opposed to the company’s share repurchase plan, in my opinion is the single biggest obstacle that retail investors need to get over when considering an investment here. Especially for tax-advantaged accounts, Calpine can give utility-sector exposure to improve account diversification while simultaneously providing an excellent growth vehicle long-term. Long-Term Tends Remain Intact Increasingly stringent environmental regulations in the United States are not going away anytime soon, despite heavy lobbying from the coal industry and some outdated utility players. 63% of Americans now believe in climate change according to a recent Yale study on the subject. Such a large voting bloc can’t be ignored going forward and any attempts to strip down/repeal current EPA mandates are likely to be met with fierce voter opposition. Unfortunately the facts remain that America’s coal fleet is incredibly old; the average coal-fired power plant was constructed in the 1970’s. Bolt-on fixes to reduce greenhouse gas emissions on these plants are going to become increasingly more expensive and subject to diminishing returns. On the same coin, new construction of coal plants, which are highly capital intensive and require decades for payoff, are unlikely in the current regulatory environment regulating CO2 and other gases. Likewise, we aren’t shutting off coal and switching to wind/solar/hydroelectric overnight. We simply don’t have the technological capacity or the investable capital to meet our current energy needs with these processes yet. Renewable energy’s share of power generation is highly likely to continue growing quickly over the coming years, but the time when renewables constitute the majority of American power generation is likely many decades away. * Historical natural gas price chart 2008-2015 By comparison, plants fired by natural gas, which constituted 95% of Calpine’s power generation in 2014, are set to the biggest beneficiaries of the production switch. Cheap natural gas from the American shale revolution likely isn’t going away anytime soon and will continue to be an amazing source of cheap power input for natural gas plants. While fracking is also a highly contentious environmental issue, opinion is more divided here than with opinions on the coal industry and climate change and may be symptomatic of a lack of understanding of the process rather than the actual science behind it. A federal ban or hamstringing regulation is highly unlikely at this point and states where fracking occurs are treading carefully given the boost the process has given local economies. Reducing Debt, Freeing Up Cash flow Calpine holds a stigma after dealing with a bankruptcy in 2005. Natural gas prices were sky-high, competition was stiff with new plants coming online the company’s markets, and the company’s $22B debt load was simply unsustainable. The company now has more assets than it did pre-bankruptcy and the debt load much smaller at $11.84B, so investors should not have little fear of a repeat. * Calpine Investor Presentation Additionally, average yearly interest expense has come down significantly during this timeframe, saving the company hundreds of millions over the past few years as the company takes advantage of the low interest rate environment. As the debt comes down over the next few years, this frees up capital for the company to continue to purchase shares at an elevated rate or invest in new acquisitions that will generate substantial additional earnings (like the Fore River purchase from Exelon in August of 2014). 1Q 2015 Results, Rest-Of-Year Outlook First quarter was in-line with management guidance. This sported a tough year/year comparable because of the polar vortex, which provided an extremely healthy boost to first quarter results last year (adjusted EBITDA in the east region was down from $269M to $125M y/y). Of note is management’s reaffirmation of 2015 adjusted EBITDA (basically EBITDA plus debt extinguishment, one-off maintenance, operating leases, and stock-based compensation) of $1.9-2.1B. For investors used to EBITDA, EBITDA is forecast to be $1.5-$1.7B. This places estimates of 2016 EV/EBITDA firmly in the 10-11x range, which is honestly in-line with broader market peers. The difference here is this is severely discounting Calpine’s advantages. Its fleet is young (average plant age of 14 years), giving the company an advantage over aging peers. As we’ve noted, it has no projected expensive regulatory overhang from EPA emission mandates. It operates in some of the strongest power markets in the United States (California, Texas, and the Northeast). Of note are the share repurchases. Total spent on repurchases totaled $236M through 4/30/15. Pushing this through the rest of the year (although perhaps management may elevate purchases due to lower prices at current levels) and it is likely that Calpine will retire $700M+ worth of shares at current rates. If prices remain at current levels, this could end up retiring 10%+ of the float in one year, just from free cash flow (free cash flow for 2015 is projected at between $800-$1B). Conclusion Calpine remains a strong buy and I’m unsure of what has driven the current selloff other than sector rotation, which has been a driving theme of 2015 as utilities have swung out-of-favor due to the impacts of a looming fed rate hike, which impacts utilities in regards to value of the dividend yield (no impact on Calpine as it pays no dividend) and the possibility of higher interest costs (approximately 50% of Calpine’s debt is variable rate, generally tied to LIBOR + a fixed rate). Most investors would be well-suited to include Calpine in their investments, especially younger investors that have a long timeframe to allow the secular trends to play out in the company’s favor. Even short-term traders may be interested, given the company is going to perform strongly in the back half of the year where it traditionally has not, giving the company an opportunity to trounce year/year comparables. Disclosure: I am/we are long CPN. (More…) I wrote this article myself, and it expresses my own opinions. I am not receiving compensation for it (other than from Seeking Alpha). I have no business relationship with any company whose stock is mentioned in this article.