Tag Archives: etf-hub

Trade Ideas To Make Money From The Strong U.S. Dollar – Idea 1

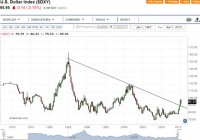
Summary A stronger U.S. Dollar will make USD denominated emerging market debt to become more expensive. As higher default risks get priced into sovereign bonds especially post the Greek debt default saga, a significant price decline could ensue. The slowing emerging market growths are not positive for emerging market debts. The U.S. Dollar has been on a tear since July 2014 and the knock-on effects of a significantly stronger U.S. Dollar have already been felt amongst the whole spectrum of commodities. With the U.S. Dollar having convincingly broken out a multi-year downward trendline (see chart below), it is quite apparent that we are only in the early stages of the USD bull market. The two main reasons which underpin my view are as follows: Divergence in monetary policy – As the U.S. intends to raise rates while the rest of the major economies are still easing, this will incentivise investors to hold more USD denominated assets. The global Carry Trade which is in the trillions of USD is likely to see a reversal as U.S. interest rates rise. This will cause the USD to get bid. Since the USD is still the world’s reserve currency and most transactions are denominated in USD, it goes without saying that this USD bull market will not only radically change the dynamics worldwide but this will undoubtedly also create exciting trading opportunities in a panoply of areas. This series will look at ideas in the following areas: Emerging Market Debt (Idea 1) Emerging Market Equity (Idea 2) – we’ll shortlist a few opportunities at the Emerging Markets Indices level and at the Individual Stocks level. The U.S. Equity Market (Idea 3) – we’ll shortlist a few opportunities at the Individual Stock level. Opportunities in the currency space (Idea 4) – we’ll shortlist a few currencies which still offer good risk/reward. (click to enlarge) The knock-on effects of the nascent USD bull market are many. Today, I’ll talk about one of the ways I intend to play the stronger USD. Before giving away my trade idea, let’s go back a few years in history. Ultra-low interest rates in the U.S. have allowed several countries mainly emerging economies to borrow cheaply in USD to invest in their local economies with the idea that local investments are going to yield much higher interest rates. Logic has it that if you borrow in USD, you need to pay back your loans in USD as well. With the USD significantly higher nowadays than when the loans were taken, the latter are undoubtedly getting more expensive to service. We can even go further and look at the slowing pace of GDP growth in emerging economies including China to deduce that the local investments are no longer yielding as high returns as they used to. TRADE IDEA Shorting emerging market government bonds denominated in USD is my way of playing out the dynamics I have outlined earlier. The iShares J.P. Morgan USD Emerging Markets Bond ETF (NYSEARCA: EMB ) provides a great way to structure this trade idea especially for retail traders and the non-professionals who might not have access to express their views on emerging market bonds. EMB is an ETF holding various Emerging Market bonds which are denominated in USD. EMB is therefore negatively-correlated to the U.S. Dollar as shown below: (click to enlarge) The top 10 holdings of EMB are as follows: Name Weight (%) Market Value Duration Notional Value RUSSIAN (FEDERATION OF) RegS 1.92 $105,401,168 4.25 105,401,167.71 ARGENTINA REPUBLIC OF 1.11 $60,941,923 7.93 60,941,923.07 PERU (REPUBLIC OF) 1.02 $56,204,117 10.64 56,204,116.84 POLAND (REPUBLIC OF) 1.02 $55,977,705 3.54 55,977,705.36 URUGUAY (ORIENTAL REPUBLIC OF) 1.02 $55,887,349 15.02 55,887,348.87 POLAND (REPUBLIC OF) 0.98 $53,632,120 5.71 53,632,120.47 PETRONAS CAPITAL LTD. RegS 0.92 $50,412,611 3.68 50,412,611.24 ROMANIA (REPUBLIC OF) MTN RegS 0.89 $48,771,815 5.34 48,771,814.69 HUNGARY (REPUBLIC OF) 0.81 $44,693,103 4.83 44,693,103.00 LITHUANIA (REPUBLIC OF) RegS 0.81 $44,657,864 5.36 44,657,863.89 The complete Holdings data of EMB is available here . I believe we are still in the early stages of the trade and we have a long way to go as the U.S. starts tightening and Emerging Markets start getting squeezed. The Fed has indicated that rates will not rise too quickly but I believe that once rates come up and people start anticipating the changes in dynamics worldwide, emerging market bond prices could accelerate downwards owing to the catalysts discussed below. The time horizon for this trade to play out would be around 1 year starting from the date the U.S. starts raising rates. From the graph above, we can see that the risks associated with the increasing U.S. Dollar have not yet been priced into EMB (see the divergence). CATALYSTS A strengthening U.S. Dollar will raise the probability of defaults. Although if none of the emerging countries defaults, when the increased risks get priced into the bonds this will likely create downward pressure on bond prices. The odds of higher default risks getting priced in are quite high post the Greek debt default saga. The slowing economic growths in multiple emerging markets could act as a tailwind to EMB’s collapse. One salient example is Russia which is the world’s largest exporter of energy. It is technically in a recession since the collapse of the oil price. In addition, inflationary pressures could provide further impetus to raise rates to stoke inflation. The effective duration of the portfolio is 7.53 years. When risk gets priced in, a long-duration portfolio is likely to face significant downward pressure. (Theoretically, for every 1% rise in yield of the portfolio, we expect the portfolio to go down in value by 7.53%). The imminent rise in the U.S. interest rates could also pose a danger to emerging market bonds as ultimately, the U.S. starts exporting its tightening monetary policy overseas. Technically, EMB looks poised for breaking the near-term resistance level around the 107.50-108 area. Once this happens, we’ll be looking at testing the 105 level and if this goes, EMB could quickly accelerate towards 100 break down further. (click to enlarge) As always, we can’t have 100% certainty when putting on a trade but as traders, our job is to put all the odds in our favor. We have an unfavorable macro environment for emerging market debt and in addition to that, slowing economic growths in emerging countries are likely to put pressure on sovereign debt financing. Furthermore, we’ve seen that the EMB portfolio has a long duration and any spikes in bind price volatility due to increased risks being priced in have the potential to accelerate the decline of the EMB. Disclosure: I am/we are short EMB. (More…) I wrote this article myself, and it expresses my own opinions. I am not receiving compensation for it (other than from Seeking Alpha). I have no business relationship with any company whose stock is mentioned in this article.
Exelon’s Dividend Disappointing, But Valuation Tempting

Summary Exelon has one of the largest retail customer bases among energy providers in the US. Though Exelon boasts a nice dividend yield, dividend growth investors have been disappointed and rightfully so. The firm is in the process of acquiring energy provider Pepco, a potentially lucrative move. Let’s take a look at Exelon’s recent performance and derive our fair value estimate for shares. By Paul Tait (click to enlarge) Exelon (NYSE: EXC ) is one of the US’ largest competitive energy providers and perhaps is best known for operating the largest nuclear fleet with over 19,000 megawatts (nearly enough energy to power 19 million homes). That’s incredible! No matter how much we like the company, however, its dividend payouts haven’t been electric in recent years, to say the least. We said Exelon’s dividend wasn’t on steady ground in the past, and we strongly encourage investors to not simply write off utilities’ dividends as safe . First Energy (NYSE: FE ) was another utility that cut its dividend, and Exelon’s Dividend Cushion ratio remains a lackluster 0.7 (anything less than 1 is unexciting). In recent news, Exelon is in the process of acquiring Washington, DC-based utility-holder Pepco. The deal would strengthen the firm’s hold on the mid-Atlantic utility market, and should the acquisition go through, Exelon would control nearly 80% of Maryland’s electric consumers. Critics are worried about price hikes, but that’s why investors like utilities in the first place: they’re legal monopolies. In this piece, let’s dig deeper into Exelon’s investment considerations and derive our fair value estimate of the firm’s stock price. Exelon’s Investment Considerations Investment Highlights • Exelon is a large competitive energy provider, with one of the largest retail customer bases in the US. It owns approximately 35,000 megawatts of power generation, including the nation’s largest nuclear fleet of more than 19,000 megawatts. It is also the US’ second-largest regulated distributor of electricity and gas. • Exelon is an important reminder as to why utility dividends aren’t always safe. Though many utilities boast regulated returns, their operations do not lend themselves to substantial financial flexibility. Credit quality will always take priority over dividend payments at key credit thresholds. The Dividend Cushion ratio considers both future free cash flows, the capital intensity of the business, as well as future cash dividend payments in coming to a comprehensive assessment. • The merger of Exelon and Constellation Energy has created one of the lowest-cost power generation fleets in the US. The tie-up offers opportunities for O&M synergies, portfolio optimization, and overhead savings. More than half of the combined company’s portfolio will be low-cost nuclear. Its acquisition of Pepco will further augment its presence. • Exelon recently slashed its dividend to a payout of $1.24 per year. Even after the cut, we don’t think the firm has strong dividend growth prospects. We’re not expecting increases anytime soon. Dividend growth investors are quite unforgiving. They may never come back to Exelon… ever again. Business Quality Economic Profit Analysis In our opinion, the best measure of a firm’s ability to create value for shareholders is expressed by comparing its return on invested capital with its weighted average cost of capital. The gap or difference between ROIC and WACC is called the firm’s economic profit spread. Exelon’s 3-year historical return on invested capital (without goodwill) is 5.8%, which is below the estimate of its cost of capital of 7.9%. As such, we assign the firm a ValueCreation™ rating of POOR. In the chart below, we show the probable path of ROIC in the years ahead based on the estimated volatility of key drivers behind the measure. The solid grey line reflects the most likely outcome, in our opinion, and represents the scenario that results in our fair value estimate. Valuation Analysis This is the portion of our analysis that powers our opinion on a company’s shares. Below we outline our valuation assumptions and derive a fair value estimate. Our discounted cash flow model indicates that Exelon’s shares are worth between $30-$44 each. Shares are currently trading at ~$32, near the bottom of our fair value range. We feel there is more upside potential than downside risk associated with shares at this time. The margin of safety around our fair value estimate is driven by the firm’s LOW ValueRisk™ rating, which is derived from the historical volatility of key valuation drivers. The estimated fair value of $37 per share represents a price-to-earnings (P/E) ratio of about 19.7 times last year’s earnings and an implied EV/EBITDA multiple of about 9 times last year’s EBITDA. Our model reflects a compound annual revenue growth rate of -1% during the next five years, a pace that is lower than the firm’s 3-year historical compound annual growth rate of 13.2%. Our model reflects a 5-year projected average operating margin of 17.4%, which is above Exelon’s trailing 3-year average. Beyond year 5, we assume free cash flow will grow at an annual rate of 0.8% for the next 15 years and 3% in perpetuity. For Exelon, we use a 7.9% weighted average cost of capital to discount future free cash flows. (click to enlarge) (click to enlarge) Margin of Safety Analysis Each fair value estimate we provide is flanked by a margin of safety, within which we feel a company is fairly valued. Our discounted cash flow process values each firm on the basis of the present value of all future free cash flows. Although we estimate the firm’s fair value at about $37 per share, every company has a range of probable fair values that’s created by the uncertainty of key valuation drivers (like future revenue or earnings, for example). After all, if the future was known with certainty, we wouldn’t see much volatility in the markets as stocks would trade precisely at their known fair values. Our ValueRisk™ rating sets the margin of safety or the fair value range we assign to each stock. In the graph above, we show this probable range of fair values for Exelon. We think the firm is attractive below $30 per share (the green line), but quite expensive above $44 per share (the red line). The prices that fall along the yellow line, which includes our fair value estimate, represent a reasonable valuation for the firm, in our opinion. Future Path of Fair Value We estimate Exelon’s fair value at this point in time to be about $37 per share. As time passes, however, companies generate cash flow and pay out cash to shareholders in the form of dividends. The chart above compares the firm’s current share price with the path of Exelon’s expected equity value per share over the next three years, assuming our long-term projections prove accurate. The range between the resulting downside fair value and upside fair value in Year 3 represents our best estimate of the value of the firm’s shares three years hence. This range of potential outcomes is also subject to change over time, should our views on the firm’s future cash flow potential change. The expected fair value of $44 per share in Year 3 represents our existing fair value per share of $37 increased at an annual rate of the firm’s cost of equity less its dividend yield. The upside and downside ranges are derived in the same way, but from the upper and lower bounds of our fair value estimate range. Wrapping Things Up We like what mergers have done for Exelon in the past — its merger with Constellation has helped create one of the lowest-cost power generation fleets in the US — and we like the potential acquisition of Pepco. If it passes the Washington, DC regulators, it would provide the firm with undeniable market presence and pricing power in the mid-Atlantic region. The company’s dividend prospects stand to benefit from the merger as well. Its dividend has been through a rough stretch in recent years, and cash flows will need to improve dramatically to help the situation. After disappointing dividend growth investors, the company will be working hard to regain their trust. All things considered, however, the company is worth keeping on the watch list in light of its valuation. It registers a 3 on the Valuentum Buying Index . (click to enlarge) Performance In the spirit of transparency, we show how the performance of the Valuentum Buying Index, our stock selection methodology, has stacked up per underlying score as it relates to firms in the Best Ideas portfolio. To understand how we derive the VBI for each company, please download the pdf here . Past results are not a guarantee of future performance. Thank you for reading! (click to enlarge) Disclosure: I/we have no positions in any stocks mentioned, and no plans to initiate any positions within the next 72 hours. (More…) I wrote this article myself, and it expresses my own opinions. I am not receiving compensation for it (other than from Seeking Alpha). I have no business relationship with any company whose stock is mentioned in this article.
UNG Remains Range-Bound

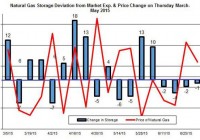
Summary The injection to storage was 69 Bcf – close to market expectations. The price of UNG bounced back. The demand for natural gas in the power sector could climb back up on account of warmer weather. The oil and natural gas market remained range-bound in recent weeks. The price of United States Natural Gas (NYSEARCA: UNG ) bounced back last week, even though the injection to storage was close to market expectations and the weather — while it keeps heating up in many parts in the U.S. — hasn’t driven up the demand for natural gas in the power sector. Moreover, the price of UNG remained range-bound for recent weeks. Will the warmer weather start to heart up the natural gas market? According to the latest EIA report , the injection to storage was 69 Bcf, which wasn’t far off market estimates. Over the next few weeks the market estimates the injections to storage will be higher than normal — on average over 85 Bcf per week, while the five-year average is around 65 Bcf. The higher injection could be driven by higher production and even more so by softer demand. But is the demand expected to cool down? As of last week, the natural gas market has cooled down. The demand for natural gas changed course and slipped by 3.2% week over week. Most of this fall came from softer demand in the power sector. Even though other sectors — including industrial and residential/commercial — also saw a decline in consumption. As of last week, total consumption is up by 4.6% year on year. That’s not far off of the current annual outlook growth in consumption. Despite the drop in demand for natural gas in the power sector, in the coming weeks the weather is projected to be much warmer than normal — mainly in the West and parts of the South Atlantic. Also, the cooling degree days (CDD) are estimated to be higher than normal by 9 degrees, and by 8 degrees compared to last year. The higher temperatures and CDD could suggest a rise in consumption in the power sector. How Will the Price of UNG React to the Storage Report? During the winter time, the price of natural gas tends to react to the news about the changes in storage. But during the summer the correlation tends to be weaker and has a smaller impact on the price of UNG. So far this injection season the price of natural gas seems partly correlated to the deviation from market expectations. (click to enlarge) Source: Data taken from the EIA. The natural gas output inched down by 0.2% last week, but it’s still up for the year by nearly 5%. Baker Hughes reported a decline of nine gas rigs to 219. Conversely, oil rigs have gone up by 12 during the previous week. But oil rigs are also down for the year. Finally, the movement in the oil market, which shouldn’t have an impact on natural gas prices, still seems to coincide to a certain extent, as presented in the chart below. The correlation between the two data sets is 0.24. (click to enlarge) Source: Data taken from the EIA. In both cases, energy prices have been range-bound as the market continues to figure out what’s next for the energy market, and if and when we will see a drop in the production of U.S. oil companies. So far, oil and gas companies have reduced the number operating rigs and slashed capex for 2015. But these measures have yet to cool down the U.S. oil and gas yield. The injection season still has a few more months to go, in which the injections to storage are still expected to be higher than normal. Nonetheless, the hotter-than-normal weather in the coming weeks could start again driving up the demand for natural gas in the power sector, which could bring the price of UNG back up. Or, at the very least, it could keep prices range-bound. (For more, please see ” Natural Gas Is Still Floating … Barely .”) Disclosure: I/we have no positions in any stocks mentioned, and no plans to initiate any positions within the next 72 hours. (More…) I wrote this article myself, and it expresses my own opinions. I am not receiving compensation for it (other than from Seeking Alpha). I have no business relationship with any company whose stock is mentioned in this article.