Tag Archives: etf-hub

The Great Recalibration: The Appearance Of Risk Aversion In Credit Spreads And Equity ETFs

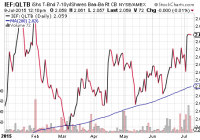
I have noticed a trend toward risk aversion that may adversely affect U.S. stocks. Investors may be in the process of adjusting their expectations for what central banks in Europe, Asia and the United States are capable of achieving. Sure, central banks may try to prevent recessions; they may attempt to inflate stock prices, decrease borrowing costs and/or depreciate currencies. In the end, though, their powers may extend no further than the collective confidence of market participants. Investors have seen a great deal of volatility in U.S. treasuries over the past six months. Early in the year, the combination of recessionary data stateside as well as quantitative easing (QE) measures in Europe helped propel demand for U.S. sovereign debt. Then came the massive unwind, alongside Fed hints at upcoming rate hikes; treasury yields spiked. More recently, the Greece default and the market meltdown in China gave treasuries their groove back. At present, the 10-year yield (2.25%) sits pretty darn close to where it sat at the start of 2015. If I had to project where that yield would be at the end of the year, I’d tell you that it might move up, down and around, but that it would ultimately be near where it is today. I feel the same way about the greenback. In essence, I anticipate that the U.S. dollar may jump around, but that it will not move substantially higher or lower over the next 6 months. In other words, irrespective of financial system shocks, geopolitical uncertainty or central banker gamesmanship, both the buck and the 10-year may be directionless. If I see little reason to invest in the greenback or bet against it, if I do not see value in adding meaningfully to treasuries in a portfolio or betting against them, why discuss U.S. sovereign debt or the U.S. currency at all? Primarily, I have noticed a trend toward risk aversion that may adversely affect U.S. stocks. Take a look at the price ratio between treasuries and crossover corporates – U.S. company bonds that span the lowest end of investment grade (Baa) universe through the highest-rated “junk” (Ba) arena. One can do this by comparing the iShares 7-10 Year Treasury Bond ETF (NYSEARCA: IEF ) with the iShares Baa-Ba Rated Corporate Bond ETF (BATS: QLTB ). In essence, since March, there have been higher lows in the price ratio and a consistent ability for IEF:QLTB to maintain above its long-term trendline. Moreover, the momentum in IEF:QLTB indicates a widening in credit spreads such that investors may be increasingly turning toward the return of capital over a return on capital. The credit spread evidence is hardly an indication of blood in the streets of Pamplona. Nevertheless, the iShares MSCI Spain Capped ETF (NYSEARCA: EWP ) sits near 2015 lows; its current price is well below a long-term 200-day moving average. Indeed, investors may be doubting the ability of the European Central Bank (ECB) to find a path forward. It is one thing to express a desire to “do whatever it takes” to preserve the euro-zone. It is another thing to keep debt-fueled excesses from fracturing alliances. Granted, the People’s Bank of China (PBOC) may eventually contain the fallout from the lightning quick collapse of Chinese equities in Shanghai. And central bankers may yet find a way to kick the toxic debt can down a European cobblestone path; that is, a disorderly “Grexit” for Greece is not an absolute certainty. Even the upswing in S&P 500 VIX Volatility (VIX) is merely a sign that folks are willing to pay a little bit more for index option protection than they were a few weeks earlier. On the other hand, the deterioration in U.S. stock market internals has been decidedly bearish. Both the NYSE Composite and the S&P 500 have significantly more 52-week lows than 52-week highs. Similarly, the number of advancing stocks relative to the number of declining stocks for both indexes has been steadily dropping since mid-May. What these breadth indicators tell you is that fewer and fewer stocks are carrying the entire ship. Like Atlas trying to hold the weight of the world on his shoulders, should he shrug, the benchmarks may buckle. If nothing else, we may be witnessing a “Great Recalibration.” (Did I just come up with a new term?) Investors may be in the process of adjusting their expectations for what central banks in Europe, Asia and the United States are capable of achieving. Sure, central banks may try to prevent recessions; they may attempt to inflate stock prices, decrease borrowing costs and/or depreciate currencies. In the end, though, their powers may extend no further than the collective confidence of market participants. Here’s a look at one last chart that supports the notion that the smarter money may be moving toward risk-off assets. On a month-over-month basis, the FTSE Multi-Asset Stock Hedge (MASH) Index is outperforming the S&P 500. The MASH Index is a collection of non-stock assets that tend to do well in bearish environments, including the yen, the franc, munis, long duration treasuries, inflation-protected securities, German bunds and gold. Disclosure: Gary Gordon, MS, CFP is the president of Pacific Park Financial, Inc., a Registered Investment Adviser with the SEC. Gary Gordon, Pacific Park Financial, Inc, and/or its clients may hold positions in the ETFs, mutual funds, and/or any investment asset mentioned above. The commentary does not constitute individualized investment advice. The opinions offered herein are not personalized recommendations to buy, sell or hold securities. At times, issuers of exchange-traded products compensate Pacific Park Financial, Inc. or its subsidiaries for advertising at the ETF Expert web site. ETF Expert content is created independently of any advertising relationships.
Long Duke, But Don’t Load Up Just Yet

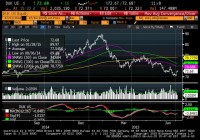
Summary An abnormal growth trend in the past two years has caused a relatively stable industry to see much decline due to energy conservation and a lack of overall demand. Bad PR surrounding the new EPA rulings on carbon pollution and coal ash have created nightmares for Duke, resulting in a 10% decline on the year. Capitalization on the higher demand for energy during the summer could help bolster the stock short-term, along with a potential share buyback. Achieving the EPS, setting a greater growth trend for the dividend, keeping the credit ratings high, and EPS growth at least a 5% for the long-term are all pivotal to. After viewing the dividend hike to 82.5 cents a share and sifting through some high short interest stocks, I came across a well-known name: Duke Energy (NYSE: DUK ). Deep in the integrated utilities, the Charlotte -based energy company is a long-time energy producer suffering from a poor growth trend due to a lagging commodities sector and lethargic demand. The company deserves a hold rating, as very few growth catalysts are leadings its outlook. Having only had a positive FCF since 2012, now in the amount of $1.09 billion on a LTM basis, I’m concerned that the recent dividend raise might eat too significantly into FCF. Furthermore, with Lynn Good increasing her salary by 50%, but more notably her short and long-term incentive opportunities to higher multiples of her salary, I believe the money could be better well-spent given their lagging growth recently. Sure, they did implement a new retirement program , but again, there are bigger problems that Duke is facing besides employee turnover. As I figured, the stock saw a lot of downward momentum at the end of the winter, and has really just been on a slow down trend since the spring started. We’re seeing really interesting support around the $70 level. The stock is at April 2013 levels, where they were fairing much the same as they are now. The second half of 2014 proved to be an exceptional growth trend, just about scraping the $90 level, but I can’t reasonably expect the stock to trend in that direction for quite some time. (click to enlarge) Source: Bloomberg We’ve seen a good, but not great three year revenue growth trend from Duke, with most of the gains coming in 2012. With revenues now well above $25 billion, I’m concerned that they won’t be able to sustain this level. Their International Energy segment has seen a small decline of 1.15% over the past three years, which accounts for about $1.4 billion in revenue each year. While much of their efforts are concentrated in Latin America, Brazil has been of particular interest to the company. Much of the operations are similar to their domestic segment, Brazil is suffering from a poor wet season and high water demand, causing reservoirs to be low and inefficient for their hydropower plants. Furthermore, I can’t see them having huge international growth when things like their quarter interest in National Methanol Company (NMC) in Saudi continues to suffer from extremely low margins. Luckily, International Energy does not account for a substantial portion of total revenue, but it’s worth noting that hydropower in Brazil will be lower in future quarters based upon thermal power being prioritized over hydropower and this trend will continue through the end of the year, already down 52.9% in terms of pricing. Sure, there are a few construction and renovation projects that Duke has going for them, but they’re not going to see the light of day until three or four years out, let alone reach their highest potential capacity. For example, a 750 MW natural gas-fired generating plant in South Carolina, which cost about $600 million, won’t be available for use until late 2017 ( 10-Q ). Even little things like the switching from lead acid to lithium-ion batteries in the Notrees Windpower Project in Texas are important steps in helping long-term efficiency and stability for the company. They just recently gained a 40% stake in the $5 billion venture to build the Atlantic Coast Pipeline, which will bring natural gas from Marcellus and Utica in Pennsylvania to West Virginia and coast Virginia and then to North Carolina. Additionally, a 1640 MW combined cycle natural gas plant in Citrus Country Florida, expected to be finished in 2018, will cost $1.5 billion. Based upon hedging activities from many oil companies, like Oasis Petroleum (NYSE: OAS ), running out next year, the input fuel could be very cheap to Duke. On a different note, the stock repurchase program that began earlier this year still has about 15% left approved, which represents a good buyback of about $225 million. This will certainly help push the shares up for a few sessions. The Commodities Caveat Apart from construction and financial growth catalysts, which will have seemingly minimal effects, the commodities market could really end up hurting this company if prices rise. While natural gas prices, via the Henry Hub below, have been on a great YOY downtrend, which reduces input costs, there’s a caveat present. (click to enlarge) Source: Bloomberg With an oversupply of natural gas and plants at Duke reaching 94% capacity, they’re going to suffer from limited profitability. Revenues will eventually decline due to a lower margin received for their output. While demand for natural gas isn’t increasing, but is rather just being adopted as coal-based energy retreats, Duke could have a real profitability problem on its hands, considering their profit margin is expected to drop over 9% this year. The exact same case applies to oil and company management has estimated that the negative effects will be anywhere from 2.5-5% of EPS. I firmly believe their operating margin will remain strong around 24%, but I would need to see significant improvement for this utility company to fend off tough macro conditions. Speaking of said conditions, with a proposed interest rate hike from the Fed later this year, company management has stated that EPS could be affected as much as -$0.07 in the following quarter. Need For Improvement I firmly believe that their regulated utilities segment needs to start showing growth before a reasonable entry point can be made into the stock. Accounting for $22.2 billion in total revenue, the entire segment is up about 27.92% in the past three years, but this has already been priced into the stock, considering many of the gains took place in FY 2014 and FY 2012. Their primary servicing region of the Carolinas, Florida, Ohio, Kentucky, and Indiana has about 7.3 million retail customers. Yet, take a look at the factors hampering their growth: Energy efficiency and conservation efforts, particularly in residential areas The Midwest and Carolina servicing regions were lagging; residential growth, overall, was down 1.4% A higher amount of unserviceable calls than normal this past winter and an increasing number of outages this summer Their commercial power segment, which really only represents a fraction of a percent of total revenue, has suffered a 53.22% three-year decline. Their focus, here, is on alternative energy sources, primarily wind and solar. Regulation Woes Rising Regulation via the EPA’s “Clean Power Plan” set to cut carbon pollution for power plants by 30% by 2030 will pass this summer ( Bloomberg ). This effectively eliminates a coal from being the major energy generator in the long-term, as now the cost structure is unfavorable. Coal Ash Disposal has become a recent nightmare for Duke as they are now required to dispose of the coal ash at four major sites sustainably by 2019 and have all sites cleared by 2029. CBS’ 60 Minutes even dedicated an entire segment towards criticizing the current disposal process of Duke. The estimated cost is about $3.4 billion, or about 3x FCF, currently. Again, the company will still be fine in the long-term as they have a current available liquidity of $6.4 billion, and while they could use a bump up in their credit ratings, the company is standing on solid ground. (click to enlarge) Source: Company Presentation Conclusion On the back end, Duke may benefit from higher D&A costs when it comes time for quarterly reports based upon the pipeline and construction activity, Duke Energy will report quarterly earnings on August 6th, just after the end of July surge of earnings reports from major oil and gas companies. It’s worth noting that their Q3 EPS levels have been historically higher than all other calls, and with projections showing a potential 50% increase in EPS from Q2 to Q3 of this year, the stock is definitely worth considering. Looking to the future, I believe this company will most likely be fine – but there’s too much short-term negativity clouding any decent chance at profitability. Note: All Financial Data Taken From Bloomberg Database Disclosure: I/we have no positions in any stocks mentioned, and no plans to initiate any positions within the next 72 hours. (More…) I wrote this article myself, and it expresses my own opinions. I am not receiving compensation for it (other than from Seeking Alpha). I have no business relationship with any company whose stock is mentioned in this article.

Q2 2015 U.S. Equity Fund Performance Summary

By Tom Roseen Despite hitting multiple record highs and triple-digit lows over the three months, the markets were generally in a sideways pattern during second quarter 2015. While the Russell 2000 and the NASDAQ Composite managed to break into record territory in mid-June, advances to new highs were generally just at the margin. However, at June month-end concerns about the Greek debt drama, looming U.S. interest rate increases, Puerto Rico’s inability to service its public debt, and China’s recent market crash weighed heavily on investors. A positive finish for equities on the last trading day of June wasn’t enough to offset the Greek debt-inspired meltdown from the prior day, and many of the major indices witnessed their first quarterly loss in ten, with the Dow Jones Industrial Average and the S&P 500 losing 0.88% and 0.23%, respectively, for Q2, while the NASDAQ Composite gained 1.75%. However, the average equity fund (+0.09%) just managed to stay in the black for Q2, stretching the winning streak to three quarters in a row. For the quarter only 43 of Lipper’s 96 equity and mixed-equity fund classifications posted positive returns. For the second consecutive quarter Lipper’s World Equity Funds macro-classification (+1.22%) was at the top of the leader board, outpacing the other three broad equity groupings. USDE Funds (+0.03%) took the runner-up position for the quarter, followed by Mixed-Asset Funds (-0.66%) and Sector Equity Funds (-1.80%). In total, only 48% of all individual equity and mixed-asset funds posted plus-side returns for the quarter. Lipper’s preliminary Q2 2015 fund-flows numbers showed mutual fund investors were net redeemers of fund assets for the quarter, withdrawing an estimated $35.7 billion from the conventional funds business (excluding exchange-traded funds [ETFs]). During the quarter investors were net redeemers of money market funds (-$47.1 billion), equity funds (-$5.5 billion), and municipal bond funds (-$1.7 billion), but they were net purchasers of taxable fixed income funds (+$18.6 billion). In line with Q1 2015 and despite increasing geopolitical concerns, for Q2 U.S. fund investors favored nondomestic equity funds over domestic equity funds, injecting $34.5 billion versus withdrawing $40.0 billion, respectively. Nevertheless, conventional fund investors continued to show a clear preference for developed-market funds (+$33.9 billion) over emerging-market funds (+$3.4 billion) during the quarter. ETF investors (authorized participants) were net purchasers for Q2 2015, injecting $29.9 billion into equity ETFs while also being net purchasers of taxable fixed income ETFs (+$1.7 billion) and municipal debt ETFs (+$0.6 billion). The Sector Equity Funds macro-group (-1.80% [quarter] and -2.82% [June]) housed four of the five top-performing classifications in the equity universe for the quarter, but couldn’t keep itself out of the red, being once again relegated to the fourth-place spot of Lipper’s four macro-classifications. The macro-classification was dragged down by its also housing the four worst performing classifications in the universe. At the top of the list for the first quarter in 29 the Commodities Energy Funds classification (one of Q1’s laggards) returned 9.27% for the quarter and 0.40% for June. The classification benefitted from a rise in oil and gasoline prices during the quarter. The next best performing classification- Commodities Agriculture Funds (+5.28% for the quarter) benefitted from June’s rally in grain prices. Despite the on-again, off-again nature of the Greek debt drama, a volatile Chinese market, and a resurgence of news surrounding the possible default by Puerto Rico of its sovereign debt, the World Equity Funds macro-classification (+1.22%) remained at the top of the charts for the second consecutive quarter. Fund investors continued to pad the coffers of developed-market funds in our tally of estimated net flows for the quarter, but they also injected net new money into emerging markets-related funds. Despite its late-month meltdown in June, China Region Funds (+7.64%)-for the second quarter in three-outpaced the other classifications in the group for the quarter, followed by Japanese Funds (+3.95%),International Small-/Mid-Cap Growth Funds (+3.91%), and International Small-/Mid-Cap Core Funds (+3.82%). Japanese Funds got a boost from export-related stocks after the yen showed continued weakness against the greenback. India-related securities suffered from volatility at the beginning of June after the Reserve Bank of India revised its inflation forecast higher, pushing India Region Funds (-3.58%) to the bottom of the macro-classification for the first quarter in eight.