Tag Archives: etf-hub

Adding XIV, Inverse Volatility ETF, Enhances The Performance Of A Stocks And Bonds Portfolio

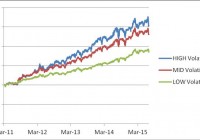
Summary A hypothetical portfolio composed of MDY, QQQ, SHY and TLT performed quite well since its inception in 2003, even during the bear market of 2008-09 and the 2011 market correction. Adding XIV to the portfolio increases the performance range significantly. The enhanced portfolio performed well during the 2011 market correction. In this article we investigate the effect of adding a volatility component to a portfolio of stock and bond ETFs that is known to perform well during market downtrends. We decided to add the VelocityShares Daily Inverse VIX Short-Term ETN (NASDAQ: XIV ), a fund initiated on 11/29/2010. Since XIV historical price data is available only from December 2010 on, and we need 65 trading days for estimating market parameters, we were able to simulate our optimal allocation strategy starting with March 2011. We performed an analysis of the difference in performance of the basic and enhanced portfolios over a 52 months period. Here is the composition of the volatility enhanced portfolio: SPDR S&P Mid-Cap 400 ETF Trust (NYSEARCA: MDY ) PowerShares QQQ Trust ETF (NASDAQ: QQQ ) iShares 1-3 Year Treasury Bond ETF (NYSEARCA: SHY ) iShares 20+ Year Treasury Bond ETF (NYSEARCA: TLT ) VelocityShares Daily Inverse VIX Short-Term ETN ( XIV ) Basic information about the funds was extracted from Yahoo Finance and is shown in table 1. Table 1. Symbol Inception Date Net Assets Yield Category MDY 5/4/1995 17.04B 1.08% Mid-Cap Blend QQQ 3/31/1999 45B 1.01% Technology Large-Cap SHY 7/22/2002 9.17B 0.42% Short Term Treasury Bond TLT 7/22/2002 17.04B 2.70% Long Term Treasury Bond XIV 11/29/2010 497M 0.00% Inverse Volatility The data for the study were downloaded from Yahoo Finance on the Historical Prices menu for MDY, QQQ, SHY, TLT, XIV. We use the daily price data adjusted for dividend payments. The portfolio is managed as dictated by a variance-return optimization algorithm developed on the Modern Portfolio Theory (Markowitz). The allocation is rebalanced monthly at market closing of the first trading day of the month. The optimization algorithm seeks to maximize the return under a constraint on the portfolio risk determined as the standard deviation of daily returns. In table 2 we list the total return, the compound average growth rate (CAGR%), the maximum drawdown (maxDD%), the annual volatility (VOL%), the Sharpe ratio and the Sortino ratio of the volatility enhanced portfolio. We simulated the performance of the portfolio under three targets of the volatility of the returns: low, mid and high. Table 2. Performance of the volatility enhanced portfolio from March 2010 to June 2015   TotRet CAGR NO.trades maxDD VOL Sharpe Sortino LOW risk 84.84% 15.26% 52 -6.90% 9.71% 1.57 2.04 MID risk 130.38% 21.28% 50 -9.83% 13.93% 1.53 2.03 HIGH risk 152.63% 23.89% 50 -12.56% 17.06% 1.40 1.82 SPY 71.93% 13.35% 0 -18.61% 15.15% 0.88 1.11 In figure 1 we show the equity curves for the portfolio with the three targets of the volatility. (click to enlarge) Figure 1. Equity curves for the volatility enhanced portfolio adaptively optimized with a low, mid, and high volatility constraint. Source: This chart is based on calculations using the adjusted daily closing share prices of securities. We also simulated the optimal allocation for maximizing the return without any volatility constraints. The results for the basic portfolio (MDY+QQQ+SHY+TLT) and the volatility enhanced portfolio (same ETFs + XIV), are shown in table 3. Table 3. Performance of portfolios optimized for maximum return without volatility constraints.   TotRet CAGR NO.trades maxDD VOL Sharpe Sortino Basic 113.00% 19.10% 16 -13.83% 15.10% 1.27 1.84 Enhanced 462.22% 49.06% 15 -39.00% 46.53% 1.05 1.22 The equity curves of the portfolios are shown in figure 2. (click to enlarge) Figure 2. Equity curves for the basic and the volatility enhanced portfolio optimized for maximum return without any volatility constraints. Source: This chart is based on calculations using the adjusted daily closing share prices of securities. As can be seen from table 3 and figure 2, the enhanced portfolio can achieve extremely high returns. Those high returns come with a high increase of the volatility of the returns. This behavior is not surprising, given the high volatility of the XIV fund. Fortunately, the XIV fund accumulates gains due to its daily rebalancing while the VIX futures are in contango because it buys the cheaper current month VIX future and it sells the more expensive next month VIX future. Of course, the rebalancing causes losses while the VIX futures are in backwardation. We compared the returns of the portfolios over the bear market of 2008, and the market corrections of 2010 and 2011. The results are shown in table 4. Table 4 Total returns of the portfolios during market downturns Time Period SPY Basic Port. Enhanced Port. 4/2011 – 9/2011 -16.22% 15.09% 11.12% As seen in table 4 both the basic and the enhanced portfolios were profitable during the 2011 market correction. We know that the basic portfolio was profitable during the 2008-09 bear market. We expect that the enhanced portfolio would also perform well, but we do not have historical data to verify it. Conclusion By adding a volatility based fund to a portfolio of stock and bond funds, we obtained a portfolio that is capable of delivering exceptionally high returns during stock bull markets. By allocating the funds based on a return-variance optimization algorithm with volatility constraints, one can achieve high returns with limited down risk during market corrections. Additional disclosure: The article was written for educational purposes and should not be considered as specific investment advice. Disclosure: I am/we are long QQQ,SHY. (More…) I wrote this article myself, and it expresses my own opinions. I am not receiving compensation for it (other than from Seeking Alpha). I have no business relationship with any company whose stock is mentioned in this article.
Adding ONEOK To My Dividend Pipeline

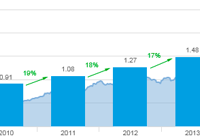
ONEOK (NYSE: ONE ) is a distributor of Natural Gas. Owning ONEOK allows me to get into the natural gas space without owning stock on the exploration side. I think of ONEOK as the FedEx (NYSE: FDX ) or UPS (NYSE: UPS ) of natural gas as it is the pipeline delivering product from point A to point B. I have wanted to get into natural gas pipeline stock, but honestly ONEOK has been overpriced until recently. Market downturns and an ongoing energy sector dip has created a good buying opportunity for this high dividend yielding stock. I purchased 40 shares of ONEOK, Inc. at $38.53 totaling $1,941.56. My Dividend Dreams Portfolio is getting heavy on energy stocks. To date, about 16% of my portfolio is in oil and gas. I prefer to only have 10% of my portfolio targeted in one area, so I will likely unload some oil stock on the next market gain. I own 100 shares of ConocoPhillips (NYSE: COP ), so this stock is the likely candidate for a reduction in shares. This purchase adds $96.80 to my annual dividend income . ONEOK Overview ONEOK, Inc. is the sole general partner of ONEOK Partners, L.P. (ONEOK Partners), a master limited partnership engaged in the gathering, processing, storage and transportation of natural gas in the United States. The company operates through three segments: Natural Gas Gathering and Processing, Natural Gas Liquids, and Natural Gas Pipelines. The Natural Gas Gathering and Processing segment provides nondiscretionary services to producers, including gathering and processing of natural gas produced from crude oil and natural gas wells. The Natural Gas Liquids segment owns and operates facilities that gather, fractionate, treat and distribute natural gas liquids (NGLs), and store NGL products, primarily in Oklahoma, Kansas, Texas, New Mexico and the Rocky Mountain region. The Natural Gas Pipelines segment owns and operates regulated natural gas transmission pipelines and natural gas storage facilities. Source: www.schwab.com. To learn more about ONEOK, Inc. visit the About Us section of the company website. ONEOK Dividends Annual Dividend Yield of 6.38% 5-Year Dividend Per Share Average of $1.37 5-Year Dividend Yield Average of 2.96% 3-Year Dividend Growth Rate of 25.3% 5-Year Dividend Growth Rate of 21% 10-Year Dividend Growth Rate of 17.1% Payout Ratio of 59.38% Dividend Coverage Ratio (NYSE: TTM ) of 168.42% The chart below shows the past eight years of annual dividends for ONEOK. This chart visually represents how impressive dividend raises have been for ONEOK. OKE has an impressive a 5-year dividend growth rate average of 21%. (click to enlarge) Source: www.schwab.com ONEOK Valuation S&P Capital IQ ranks OKE as a hold and 3-stars with a 12-month target price of $48. Morningstar ranks OKE as a buy, 4 stars with a fair value of $52. Using my dividend toolkit I used the dividend discount model analysis with the following metrics: 9% Discount Rate and an 5% Dividend Growth Rate. I get a fair value of $63.53. Conclusion I like owning distribution stocks because they own the pipeline for delivery. This is sort of a monopoly; if a seller wants to move goods, they need a distributor. There is safety in OKE because of this, however, this stock is still subject to natural gas pricing. I don’t see gas usage declining in the near future, so I am comfortable with my purchase. Also, natural gas prices are low, which means there is a lot of upside if prices recover. Full Disclosure: Long OKE

VMBS Is An Attractive Buy

Summary Federally Backed Mortgage Backed Securities Offer Comparably Attractive Returns. VMBS Has Low Fees And Holds High Quality Bonds. VMBS Is An Affordable Option For Investing In The Mortgage Securities Market. Introduction Balance is an essential aspect of investing. In the spirit of diversification, I’ve spent a measurable amount of time imploring investors to weigh the benefits of alternative investments. I’ve harped on about ETNs, inverse treasury hedging tools, and ETFs. In this article I hope to analyze the benefits of one particular ETF, the Vanguard Mortgage-Backed Securities Index ETF (NASDAQ: VMBS ). There are eight widely recognized mortgage backed securities ETFs, but there are 3 that I consider to be “investable.” They include the iShares MBS ETF (NYSEARCA: MBB ), the iShares CMBS ETF (NYSEARCA: CMBS ), and VMBS . Federal issued mortgage securities offer safe long term fixed income returns. Typically, the barrier to entry to buy an individual MBS is around $25,000. For this reason an ETF may be a more realistic option for the average investor. Now let’s take a closer look at what makes VMBS an attractive buy. Why Mortgaged Backed Securities Mortgage backed securities are safe investments that offer an optimal source of fixed income. VMBS tracks the performance of the Barclays Capital U.S. MBS index. VMBS is extremely safe because it only holds bonds issued by Ginnie Mae, Fannie Mae ( OTCQB:FNMA ), and Freddie Mac ( OTCQB:FMCC ). Fannie Mae and Freddie Mac are publicly traded companies that offer agency guarantees with the backing of the U.S. government, and Ginnie Mae mortgage securities are backed by the full faith and credit of the U.S. government. Mortgaged backed securities offer returns in excess of 1-2% above U.S. Treasuries. However, MBS do not have the same tax advantages as Treasuries (which should be individually factored into the net return). Investors looking for a safe and highly performing alternative to Treasuries should consider investing in mortgage backed securities. VMBS Analysis VMBS is a strong MBS ETF with solid underlying assets, optimal yields, and a low expense ratio. VMBS’s competitors hold a mere 48.81% in AAA rated bonds. Conversely, VMBS’s bond portfolio is 100% AAA rated bonds. The bonds that VMBS holds have an average effective duration of 3.24 years and an average effective maturity of 5.60 years. The average weighted coupon is 3.85%. Currently VMBS is priced at 106.45. VMBS is the second largest MBS ETF with over 1.45 Billion in total assets. VMBS’s total assets are second only to MBB. MBB however holds marginally lower quality bonds, and MBB has a higher expense ratio. Below VMBS is CMBS which holds 179 million in total assets. VMBS has one of the lowest expense ratios at 0.12% (which prevents cash flows getting siphoned off to cover fees). VMBS’s net SEC yield is attractive at 1.43%, and VMBS is extremely liquid as well with an average volume of 206,475. Forward Strategy A high quality fund with strong assets such as VMBS will perform optimally over its competitors in a rising interest rate environment. Janet Yellen just promised rates would rise later this year, so it is important to consider the consequences interest rates will have. I think an MBS ETF is a strong addition to a well balanced portfolio. I should note, however, that bond prices are inversely correlated to rising rates, so it is possible to see some marginal capital depreciation. On the other hand, this would likely mean VMBS’s SEC yield would increase. AAA rated bonds are less risky, and therefore maintain their value in a variety of changing environments. For this reason, I believe VMBS will perform optimally in years to come. Conclusion Consider a safe source of income that outperforms Treasuries. There are capital barriers to entry in the primary and secondary mortgage backed securities market. However, VMBS is an attractive and affordable ETF that provides broad based coverage to any investor. VMBS has strong holdings, and it is a conservative investment that won’t disappoint. Editor’s Note: This article discusses one or more securities that do not trade on a major U.S. exchange. Please be aware of the risks associated with these stocks. Disclosure: I/we have no positions in any stocks mentioned, and no plans to initiate any positions within the next 72 hours. (More…) I wrote this article myself, and it expresses my own opinions. I am not receiving compensation for it (other than from Seeking Alpha). I have no business relationship with any company whose stock is mentioned in this article.