Tag Archives: etf-hub

Are Rate Spreads And Volatility Good Market-Timing Indicators?

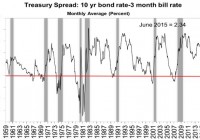
Summary This is part of a research on systemic market indicators. A summary on two rate spreads and the VIX index used as market timing indicators. A reminder of a 4-component systemic indicator presented in a former article. MTS (Multi-Timing Scores) are systemic aggregate indicators, focused on a long-term investing horizon and including the 4 main categories of market analysis: sentiment, economy, fundamentals, technicals. MTS10 is used in GHI Premium Service to send market timing alerts and size a hedge according to the systemic risk. A GHI subscriber asked me if adding parameters on credit spreads and volatility might improve it. Here is a summary of my thoughts on 3 related indicators. 10-year / 3-month spread Yield curve inversion (when long-term yields fall below shorter-term yields) has been studied in academic publications as a predictor of economic recessions in the US and other countries. The most studied data in the U.S. is the spread between rates of the 10 year bond (NYSEARCA: IEF ) and the 3 month bill (NYSEARCA: BIL ). It has worked quite well to predict recessions since 1960, with only 1 miss (the spread didn’t cross the zero line before 1960 recession) and two false signals in 1966-67. However, it gives little information about the timing. It just tells that a recession may happen in the next 6 to 20 months. Moreover, the signal (negative spread) may have disappeared before the recession really starts. It looks useful for economists and politicians, but of little help for investors. (click to enlarge) Source: New York FED As the average elapsed time between a negative spread and a recession is about 1 year, some economists have inferred a probability of recession 12 months ahead. This method predicts a probability of recession below 5% until June 2016. (click to enlarge) TED Spread The TED spread is the difference between the 3-month LIBOR and the 3-month U.S. T-bill rate. For this one, a spike is a bad omen. It did a good job at “predicting” the 1987 crash (in fact I doubt that someone was interested in it at this time) and the 2008 recession. But it was late in 1990, gave a bunch of false signals, missed the 2001 recession, and gave a late signal in 2011 during the latest meaningful market correction. (click to enlarge) Source: Saint Louis FED VIX index The VIX index measures an aggregate implied (expected) volatility on S&P 500 stocks calculated from their options. It is known as the “fear index” and may be seen as an indicator of the cost of insurance against a large market move. It usually goes up when stock indices go down. The VIX can be traded using futures, options and ETNs ( VXX , VXZ ). Two of its most interesting properties are: an attraction to its moving averages a higher probability to go up again after a day up The risk increases when the VIX goes away from its average to the downside (a sign of possible complacency) or to the upside (a sign of nervousness). It is easier to put a trigger on the downside because both properties above play in the same direction. They are opposite when the VIX goes up, making the game riskier. The next chart represents the equity curve of investing in SPY , and going in cash when the VIX is below 2% under its 10-day simple moving average (benchmark in blue is SPY “buy-and-hold”). The choice of a 10-day sma is not random, it is well-known by traders interested in the VIX. (click to enlarge) Source: portfolio123 The chart looks great, but there are a lot of intra-week signals. Global Household Index is weekly. The performance of a weekly signal is much less attractive: (click to enlarge) It is even worse with a 0.1% rate for transaction cost ($10 for $10k): (click to enlarge) I think the VIX may be very useful in setups for swing-traders, much less for investors with a mid-term or long-term horizon. This is not an original idea: in this article Mark Hulbert came to the same with other arguments. Conclusion : The 10-year / 3-month credit spread is a good recession predictor, but not a good timer. The TED spread has given timely qualitative signals twice in the past, but signals were late, missing or flawed in other cases. I didn’t find a way to use it in a quantitative indicator. The VIX index gives signals that can be used as confirmations by traders, but doesn’t seem to be a great help for investors working in weekly or longer time units. I don’t plan to integrate these indicators in my market timing scores. MTS10 components cannot be disclosed here. Interested readers can use for non-commercial purposes ( CC BY-NC 4.0 International License ) an open-source variant with 4 indicators (MTS4). It is less robust and more sensitive to economic data revisions. The component indicators are S&P 500 companies’ average short interest (bearish when the 52-week sma is above the 104-week sma); unemployment (bearish when above its value 3 months earlier); S&P 500’s current-year EPS estimate (bearish when below its value 3 months earlier); and S&P 500’s price (bearish when the 50-day sma is below the 200-day sma). When all four are bearish, it’s time to go in full hedge. This page explains how to get a limited free access to MTS4 in a popular screener, backtest it and get its value at any time. Disclosure: I/we have no positions in any stocks mentioned, and no plans to initiate any positions within the next 72 hours. (More…) I wrote this article myself, and it expresses my own opinions. I am not receiving compensation for it (other than from Seeking Alpha). I have no business relationship with any company whose stock is mentioned in this article.
How To Avoid The Worst Style ETFs: Q2’15 In Review

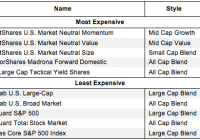
Summary The large number of ETFs has little to do with serving your best interests. Below are three red flags you can use to avoid the worst ETFs. The following presents the least and most expensive style ETFs as well as the worst overall style ETFs per our 2Q15 sector ratings. Question: Why are there so many ETFs? Answer: ETF providers tend to make lots of money on each ETF so they create more products to sell. The large number of ETFs has little to do with serving your best interests. Below are three red flags you can use to avoid the worst ETFs: 1. Inadequate Liquidity This issue is the easiest to avoid, and our advice is simple. Avoid all ETFs with less than $100 million in assets. Low levels of liquidity can lead to a discrepancy between the price of the ETF and the underlying value of the securities it holds. Plus, low asset levels tend to mean lower volume in the ETF and larger bid-ask spreads. 2. High Fees ETFs should be cheap, but not all of them are. The first step here is to know what is cheap and expensive. To ensure you are paying at or below average fees, invest only in ETFs with total annual costs below 0.49%, which is the average total annual cost of the 289 U.S. equity Style ETFs we cover. Figure 1 shows the most and least expensive Style ETFs. QuantShares provides three of the most expensive ETFs while Schwab ETFs are among the cheapest. Figure 1: 5 Least and Most-Expensive Style ETFs Sources: New Constructs, LLC and company filings Investors need not pay high fees for quality holdings. Arrow QVM Equity Factor (NYSEARCA: QVM ) earns our Very Attractive rating and has low total annual costs of only 0.72%. On the other hand, no matter how cheap an ETF, if it holds bad stocks, its performance will be bad. The quality of an ETFs holdings matters more than its price. 3. Poor Holdings Avoiding poor holdings is by far the hardest part of avoiding bad ETFs, but it is also the most important because an ETF’s performance is determined more by its holdings than its costs. Figure 2 shows the ETFs within each style with the worst holdings or portfolio management ratings . Figure 2: Style ETFs with the Worst Holding Sources: New Constructs, LLC and company filings State Street, iShares, and PowerShares appear more often than any other providers in Figure 2, which means that they offer the most ETFs with the worst holdings. Our overall ratings on ETFs are based primarily on our stock ratings of their holdings. The Danger Within Buying an ETF without analyzing its holdings is like buying a stock without analyzing its business and finances. Put another way, research on ETF holdings is necessary due diligence because an ETF’s performance is only as good as its holdings’ performance. PERFORMANCE OF ETF’s HOLDINGS = PERFORMANCE OF ETF Disclosure: David Trainer and Max Lee receive no compensation to write about any specific stock, style, or theme. Disclosure: I/we have no positions in any stocks mentioned, and no plans to initiate any positions within the next 72 hours. (More…) I wrote this article myself, and it expresses my own opinions. I am not receiving compensation for it. I have no business relationship with any company whose stock is mentioned in this article.

The Good Business Portfolio: All 24 Positions

Summary The portfolio of good company businesses is doing 3.62% better than the DOW average year to date (YTD) of -0.41%. The 24 businesses comprise 99% of the portfolio with the other 1% cash and the average total return over the DOW average for the 30 month test period is 32.52%. Create a portfolio that is balanced, not income, not dividend growth, not bottom fishing, not value, but balanced among all styles. Of the 24 companies in the portfolio 19 beat the DOW average for total return and 5 missed the total return over the test period of 30 months. This article gives my 10 guidelines for company investment selection for the complete Good Business Portfolio. The intent in these guidelines is to create a portfolio that is a large cap balanced portfolio between the different styles of investing. Income investors take too much risk to get their high yields. Bottom fishing investors get catfish. Value investors have to have a foresight to see the future. You see from the guidelines below that I want a portfolio that is defensive, provides income and does not take high risks. I limit the portfolio to 25 companies; more than this is almost impossible to keep track of. At present I have 24 companies and have open slots awaiting General Electric (NYSE: GE ) and Hewlett Packard (NYSE: HPQ ) spin-offs. Guidelines (Company selection) 1. NEVER buy any company or security that has more than three letters in the symbol. I know this eliminates just about all mutual funds, Apple (NASDAQ: AAPL ), Microsoft (NASDAQ: MSFT ), Intel (NASDAQ: INTC ) and a lot of other large cap good companies, but it also eliminates the small cap startups and many others that are not good investments for a retirement portfolio. The only exception to this guideline is the purchase of a high grade corporate investment grade bond fund. 2. Capitalization should be at least $7 Billion (share price times number of shares outstanding) 3. Company should have a dividend of at least 1.0% on a yearly basis and the dividend should have been increased in 7 of the last 10 years. 4. Cash flow should be strongly positive. This allows dividends to increase, do share buy backs, and purchase of other companies to expand the company business. You can’t make cash up by accounting tricks like World Com and Enron. 5. The company should be listed on a Major exchange (NYSE) or NASDAQ, NO over the counter and pink sheets, NO venture capital. 6. The company business should be understood. Don’t invest in business models or products you don’t understand. Would you buy the whole company if you could is the question. If yes the company can be bought (Peter Lynch). As an example I don’t understand Google (NASDAQ: GOOG ) (NASDAQ: GOOGL ). If you can actually understand how Google will continue to grow then you can buy it, except that it violates guideline number 1. 7. Never invest in the following class of companies; – Airline operations business (poor business model). They should charge a price that they can make money on. – Banking small and large (can’t tell what assets are worth). – BDCs (too much debt and bad businesses). High dividends are not worth it. It’s better to have a real company like Harley Davidson (NYSE: HOG ), that has an iconic product. 8. S&P Capital IQ rating should be at least 3 or better. Consider selling when its rating drops to 2 or 1. 9. Remember you are not buying stock; you are buying shares in a company. Consider yourself an owner; you are. This idea may seem silly but it’s one of the best in this list, very important. As an owner do your home work, read about the company every few days and check prices at least once a week. Having a list on your favorite financial site like Seeking Alpha or web home page will help. 10. Compound annual growth rate for the next three years should be projected at least 6% per year. These are guidelines and not rules. They are meant to be used as filters to get to a few companies where further analysis can be done before adding the company to the portfolio. So it’s alright to break a guideline if the other guidelines indicate a Good Company Business. I’m sure this eliminates some really good companies but it gets me a short list to work on. There are too many companies to even look at 10% of them. Portfolio Performance The performance of the portfolio created by the guidelines have year in and year out beat the DOW average for over 22 years giving me a steady retirement income and growth. The table below shows the portfolio performance for 2012, 2013, 2014, and YTD of 2015. Year DOW Gain/Loss Good Business Beat Difference Portfolio 2,012 8.70% 16.92% 8.22% 2,013 27.00% 39.70% 12.70% 2,014 6.04% 8.67% 2.63% 2015 YTD -0.41% 3.21% 3.62% In a great year like 2013 the portfolio did fantastic. In a normal year like 2014 it beat the DOW by a fair amount. So far this year the portfolio is doing good at 3.62% total return gain above the Dow average loss of -0.41%. All 24 Companies In The Portfolio The 24 companies and their percentage in the portfolio and total return over a 30 month test (starting Jan 1 2013) period is shown in the table below. I chose this time frame since it included the great year of 2013 and the moderate year of 2014 and 2015 YTD. The DOW baseline for this period is 35.54% and each of the top five easily beat that baseline. The next 19 have five companies that did not beat the DOW baseline but still are great businesses. I limit the portfolio to 25 companies and let the winners grow until they reach 8% – 9% of the portfolio and then I trim the position. BA , DIS and HD are now in trim position. I start the companies at a base percentage of the portfolio of 1% and add to the position if they perform well during the next six months. At 4% of the portfolio I stop buying and let the company percentage of the portfolio grow until it hits 8% then it’s time to trim. In the portfolio only one company is actually losing money over the 30 month test period – Freeport McMoRan Inc. (NYSE: FCX ). This is my full list of 24 Good Businesses. I hope to write individual articles on some of these businesses as time permits. DOW Baseline 35.54% Company Total Return Difference Percentage of Portfolio Cumulative Total 30 Months From Baseline Percentage of Portfolio Boeing (NYSE: BA ) 92.08% 56.53% 8.77% 8.77% Home Depot (NYSE: HD ) 86.52% 50.98% 8.66% 17.43% Walt Disney (NYSE: DIS ) 127.27% 91.72% 8.05% 33.19% Johnson & Johnson (NYSE: JNJ ) 48.98% 13.44% 7.70% 25.14% L Brands Inc. (NYSE: LB ) 99.39% 63.85% 6.73% 39.92% Harley Davidson Inc. 20.06% -15.49% 6.24% 46.17% Cabela’s Inc. (NYSE: CAB ) 16.41% -19.13% 6.03% 52.20% Altria Group Inc. (NYSE: MO ) 72.57% 37.03% 6.16% 58.36% Philip Morris INTL INC. (NYSE: PM ) 6.63% -28.92% 5.49% 63.85% McDonald’s Corp. (NYSE: MCD ) 17.78% -17.76% 5.49% 69.34% Eaton Vance Enhanced Equity Income Fund II (NYSE: EOS ) 53.55% 18.01% 5.49% 74.83% General Electric 34.39% -1.15% 4.83% 79.66% Automatic Data Processing (NASDAQ: ADP ) 46.03% 10.49% 4.12% 83.78% Ingersoll-Rand plc (NYSE: IR ) 73.55% 38.01% 2.83% 86.61% Hewlett Packard 113.11% 77.57% 2.44% 89.05% Novartis AG (NYSE: NVS ) 71.37% 35.83% 1.65% 90.70% Omega Health Inv. (NYSE: OHI ) 64.02% 28.48% 1.53% 97.35% Mondelez (NASDAQ: MDLZ ) 60.52% 24.98% 1.48% 94.64% Texas Instrument (NASDAQ: TXN ) 54.02% 18.48% 1.30% 93.16% Amerisource Bergen (NYSE: ABC ) 155.97% 120.42% 1.17% 95.82% Freeport McMoran -43.95% -79.49% 1.16% 91.86% Kraft Heinz Corp. (NASDAQ: KHC ) 82.08% 46.54% 0.82% 98.17% Alcoa (NYSE: AA ) 18.06% -17.48% 0.68% 98.85% Hanes brands Inc (NYSE: HBI ) 263.04% 227.50% 0.18% 99.03% Average 32.52% Recent (last month) Portfolio Changes and Comments Added a starter position of HBI to the portfolio. If the next earnings are good I will add to this position as the above 8% positions get trimmed to balance the portfolio. I have to see if they can continue this great performance going forward. Continued selling covered calls against part of the MCD position. I am selling out of the money calls with short duration of two weeks. MCD is a great business but is being hurt by the strong dollar and its ability to compete against new startups. I have made a little extra money while we wait for MCD to turn around. Added to EOS position now 5.5% of the portfolio. I needed some extra income so I bought a little more of EOS to increase my income. I have also started selling covered calls against FCX and CAB. I am selling out of the money calls with short duration of two weeks to three weeks. One comment: I have never bought commodity companies before and both (AA and FCX) have disappointed me. A new guideline is in the making to avoid commodity companies , it just seems too much risk and uncontrolled world events to predict what the price of a commodity will be in the future. Earnings Season Has Just Started. Alcoa had a mixed report with earnings missing the expected earnings of 0.24 compared to the actual earnings at 0.19, but the revenue beat by 110 Million. The transformation of Alcoa is starting to take effect and I will wait at least two more quarters to see if it’s a turnaround or sell. I always like earnings season since most of my Good Business companies have increasing earnings. Looking forward I expect Boeing to beat the expected earnings of $2.06 this quarter but will not trim it until it reaches 10.0% of the portfolio. Last year Boeing got above 10% and I trimmed it a little to get it below 10% of the portfolio. Conclusion The 10 guidelines in the article give me a balanced portfolio of good companies that are large cap and can grow their revenues, earnings, and dividends for years. They have the staying power to fix what ever goes wrong. In each case the company has the size and good management to fix the problem. The portfolio has growth companies, defensive companies, income companies and companies with international exposure giving it what I call balance. Of the 24 companies presently in the portfolio five are underperforming the DOW average. All five companies are being hurt by the strong dollar since they are multi-national and have a large portion of their income coming from foreign operations. it is my intention to write separate comparison articles on individual companies. If you would like me to do a review of one of my Good Business Companies please comment and I will try to do it. Of course this is not a recommendation to buy or sell and you should always do your own research and talk to your financial advisor before any purchase or sale. This is how I manage my IRA retirement account and the opinions on the companies are my own. Disclosure: I am/we are long BA, HD, DIS, JNJ, LB, HOG, CAB, MO, PM, MCD, EOS, GE, ADP, IR, HPQ, NVS, OHI, MDLZ, TXN, ABC, FCX, KHC, AA, HBI. (More…) I wrote this article myself, and it expresses my own opinions. I am not receiving compensation for it (other than from Seeking Alpha). I have no business relationship with any company whose stock is mentioned in this article.