Tag Archives: etf-hub

The Permanent Portfolio Is Dead

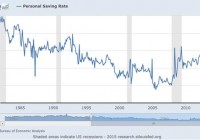
Summary Permanent Portfolio has underperformed U.S. stocks, and several stock/bond allocations, since 2012. Gold has delivered most of Permanent Portfolio’s gains since 2007; as gold underperformed since 2012, so has the Permanent Portfolio. Permanent Portfolio worked in an age of booming credit-based consumption, but does not work in an age of secular stagnation. Even if we aren’t in an age of secular stagnation, the permanent portfolio’s three-year underperformance indicates that it is no longer permanent, and is best avoided. If you’ve never heard of the permanent portfolio, consider yourself lucky. If you have heard of it, I’m sorry to tell you this: it’s not permanent anymore. Which means it really never was. That doesn’t mean it had a great run, but the run is over and it’s time to move on. What is the Permanent Portfolio? The permanent portfolio was first designed by investment analyst and libertarian politician Harry Browne, who called it a “fail-safe” investment. The idea was simple enough to appear elegant: a portfolio of equal weightings of four asset classes: * 25% U.S. stocks-e.g., the SPDR S&P 500 Trust (NYSEARCA: SPY ) or Vanguard Total Stock Market ETF (NYSEARCA: VTI ) * 25% long-term Treasury bonds-e.g., the iShares Barclays 20+ Year Treasury Bond Fund (NYSEARCA: TLT ) * 25% cash-e.g. the Short Treasury Bond ETF (NYSEARCA: SHV ), or just cash * 25% precious metals (specifically, gold)-e.g. the SPDR Gold Trust ETF (NYSEARCA: GLD ) The stocks were for times of prosperity. The bonds were for times of deflation, the cash was for times of recession, and the gold was for times of inflation. An equal weighting of all of these, the theory went, would protect an investor from any one scenario and outperform a focus on any one asset class. Harry Browne dreamed up the permanent portfolio in 1982 when rampant inflation was eating into everyone’s purchasing power and stagnant economic growth was crimping most people’s ability to earn and save. Shortly after Browne’s vision, the U.S. gave up its steady savings rate and learned to love credit cards, causing the national savings rate to plummet: (click to enlarge) The 1980s were a time of high inflation and strong stock growth, providing tailwinds for Browne’s brainchild. Those who followed Browne’s lead had market-beating returns and shockingly little volatility. According to Crawlingroad.com , the permanent portfolio had a 11.5% average return from 1982 to 1990, and no negative years (it did however have a negative return in 1981 due to a 32.9% drop in gold). Backtesting the strategy, we see only three years of negative returns since 1971: Even more impressively, the permanent portfolio managed a positive return even in years when two asset classes had horrible years, like in 1973 when stocks and bonds fell, or 2000 when stocks and gold both fell. Performance Since 2008 This was part of the PP appeal back in 2011 and 2012. The memory of the 2008-2009 crash was fresh in everyone’s minds. Real estate seemed toxic and gold was soaring. Income was getting harder to find, and everything seemed too risky. A lot of people wanted to invest, but were still terrified of the stock market. Low volatility and diversification were hot topics, and this made the Browne’s permanent portfolio come back into vogue: (click to enlarge) The chart above tracks Google searches for “permanent portfolio”, and the steady rise in 2010 to 2012, to breach spikes in searches during the 2008 crisis, is partly an indicator of just how enduring Browne’s idea is in times of fear. Those who searched back then were probably pleased with what they saw. The permanent portfolio steadily provided strong returns throughout the 90s and 2000s, and even seemed to weather the storm of 2008 , when talk of apocalypse graced the lips of the financial press: (click to enlarge) It’s no surprise, then, that many turned to the permanent portfolio, which had held steady returns largely thanks to gold and U.S. Treasuries during and immediately after the crash. Of course past performance is no indicator of future results, and those who have stayed with Browne have had some stressful times since then. The portfolio has massively underperformed stocks since 2012, and has actually lost about 15% from then to the present. To make matters even worse, Morningstar rates the Permanent Portfolio Fund (MUTF: PRPFX ) one star for its 3-year and 5-year returns, with low returns and high risk. Yet its 10-year rating is high return and above average risk with four stars. Clearly something changed in the last three years to obliterate Browne’s strategy. So what happened? Why Permanent Portfolio Doesn’t Work Anymore A quick glance at one chart shows the problem. Taking together an ETF portfolio following the PP philosophy, our basket will contain SHV, GLD, TLT, and SPY in equal amounts. Looking at these funds’ performance since 2007 tells us one thing: gold is the biggest contributor to our returns: (click to enlarge) Gold rose over 180% from start to peak, and has erased over 100 percentage points of gains since then. The fall has decelerated in recent months, but the slide in gold’s value has hit our PP severely, while both TLT and SPY provide us with much smaller, but much steadier returns since 2009. Why is gold underperforming? The primary reason is simple: a lack of inflation. If we look at the urban consumer price index (CPI-U) and the personal consumption expenditure index (PCE), which are the two biggest indices for measuring inflation used by economists both in and outside the Federal Reserve, we see an average annual inflation rate of 1.81% since 2007–far below the historic norm and below the Federal Reserve’s target: (click to enlarge) As Browne told us, low inflation means underperformance for gold. If we are in an era of secular stagnation, as Professor Larry Summers confidently tells us , then it is unlikely that we will see inflation rates rise considerably beyond that. But we also won’t necessarily see broad prosperity either, which should put pressure on stocks if quantitative easing and low yields do not drive more money into the stock market. Thus two of the four major components of the permanent portfolio are likely to drag down returns. If you disagree with Larry Summers, as Ben Bernanke famously did in a recent series of blog posts , that doesn’t mean you will necessarily benefit from the permanent portfolio either. The fact that the PP has underperformed in the last three years, providing YTD returns of -1.5%, 1 year returns of -7.6%, and 3-year annualized returns of 0.5%, tells us that the permanent portfolio is no longer permanent. It also tells us that something fundamental has changed in the world since 1982, and last generation’s sound investment advice is folly for this generation. Don’t Invest Your Politics One of Browne’s biggest appeals is his libertarian character. A former libertarian presidential nominee, the late Harry Browne wrote several books about the failure of government, the importance of self-reliance, and the importance of freedom (his most popular book is titled “How I Found Freedom in an Unfree World”). I suspect many permanent portfolio investors are likewise libertarians, who find sense in Browne’s message and thus think that will somehow translate to market-beating returns. The guilt by association fallacy here has been a costly one for investors over the last three years. Libertarian or no, investors who understand that politics and markets are separate things that may sometimes intersect have been able to avoid the allure of a permanent portfolio, and move their strategy with the market. Those who did so in 2012 and saw value in equities have beaten the Permanent Portfolio. So did those who bought high yield bonds, or those who went into real estate. Even those who bought U.S. Treasuries have done better than Browne’s followers. It is clear that the Permanent Portfolio is not so permanent anymore. For those looking for low volatility and steady appreciation, it is time to look elsewhere. Disclosure: I/we have no positions in any stocks mentioned, and no plans to initiate any positions within the next 72 hours. (More…) I wrote this article myself, and it expresses my own opinions. I am not receiving compensation for it (other than from Seeking Alpha). I have no business relationship with any company whose stock is mentioned in this article.
Forget Greece, Buy These U.K. ETFs Instead

Uncertainty regarding Greek debt negotiations has continued to dampen investor sentiment since the start of this year. To add to the crisis, Greece overwhelmingly voted against the austerity package offered by lenders last Sunday. This poses serious questions about the economic future of the nation and whether it will continue to use the euro. On the other hand, economic doldrums in the continent seem to have had little impact on the U.K. The country has outperformed the major economies, including the U.S., China and Japan, attracting investors’ attention in recent times. Greek Crisis In the recent past, several opinion polls have shown that a vote on the Greek issue of continuing to be a member of the common currency bloc would be a close affair. However, on Sunday, 61% of citizens voted against adopting further austerity measures, escalating the crisis further. Meanwhile, Greece needs to pay 3.5 billion euros to the European Central Bank (ECB) on July 20. Greece faces the threat of exiting the currency bloc if it fails to make debt payments to the ECB within the stipulated time frame. The failure to do so could also lead the ECB to trim its emergency lending to Greek banks, eventually hampering the country’s financial system. Additionally, Eurozone leaders gave Greece a Sunday deadline to submit new aid proposals. Greece needs to come up with new economic measures to avoid a default. On Tuesday, Greek Prime Minister Alexis Tsipras proposed short-term financing until the end of July from its lenders. Tsipras asked for an interim financing in exchange for some policy overhauls demanded by Greece’s creditors. Separately, the IMF said last week that the country would need a significantly large amount of funds for debt relief. Moreover, an economic crisis lasting more than seven years and youth jobless rates as high as 50% have put additional pressure on the economy. Why U.K.? While escalating Greek debt concerns continued to weigh on Europe, it’s the U.K. which has bucked the trend. According to official data, GDP rose by 0.4% for the January-March period. This is higher than the previous estimate of 0.3%. Additionally, year-over-year growth for the first quarter was also revised upward to 2.9% from the earlier estimate of 2.5%. GDP growth for 2014 was revised up to 3% from 2.8%. Also, the National Institute for Economic and Social Research estimated that the economy has expanded at a 0.7% clip in the second quarter. It is also projected that the economy will grow at a healthy rate of 2.5% this year. Reportedly, industrial output in the U.K. increased at a better-than-expected monthly pace of 0.4% in May. Also, the slump in oil prices and low inflation boosted consumer confidence in the region. A separate report showed that market research company GfK’s consumer confidence index increased by six points to a total score of seven in June, its highest point in 15 years. A year-on-year increase of 4.5% in first-quarter real disposable income was the sharpest pace of growth since 2001. Moreover, wage growth increased to 2.7% in April, witnessing the fastest pace of growth in four years. While private jobs rose 3.3% in April and the public sector posted a 0.3% gain, joblessness has declined in the U.K. for nearly six years. 2 U.K. ETFs to Buy The encouraging economic data indicates that the economy in the U.K. is on a solid footing and is emerging as the only hope in Europe. It is speculated that the country will continue on its robust growth path this year as well as the next. In this scenario, investors may consider the following two favorably ranked U.K. ETFs to strengthen their portfolio and offset Greek debt concerns. First Trust United Kingdom AlphaDex ETF (NYSEARCA: FKU ) This fund provides exposure to 74 firms by tracking the Defined United Kingdom Index. The fund has amassed $362.3 million in its asset base, while it has an average daily volume of around 97,000 shares. None of the firms account for more than 2.9% of the total assets. Sector-wise, financials take the top spot at about 30.7% share, while consumer discretionary and industrials also have double-digit allocation. FKU charges a fee of 80 bps annually and has a Zacks Rank #2 (Buy) with a Medium risk outlook. The fund has returned 10.9% over the past six-month period. SPDR MSCI United Kingdom Quality Mix ETF (NYSEARCA: QGBR ) With AUM of $2.7 million, this product tracks the MSCI UK Quality Mix A-Series Index. In total, it holds 112 securities with nearly 31.5% of its assets allocated to the top 10 holdings. From a sector look, financials take the top spot at 16.1%, while information technology, consumer staples, consumer discretionary, energy and industrials round off the top five. The ETF is the cheapest choice in its domain as it charges only 30 bps in annual fees. QGBR trades in light volume of around 4,000 shares a day. It has returned 3.7% in the last six months and has a Zacks Rank #2 (Buy). Original Post

2 Big Investments Begin To Pay Off For The Laclede Group

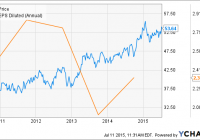
Summary Natural gas utility holding company, The Laclede Group, has seen two recent acquisitions pay off in the form of earnings growth following a period of stagnation. The acquisition of Alabama utility, Alagasco, has proven especially valuable due to that state’s favorable regulatory scheme and a likely colder-than-average upcoming winter there. Economic weakness in Missouri and Alabama could reduce the firm’s consolidated earnings growth, however, if it proves to be sustained. A solid dividend history aside, the company’s 3.4% forward yield is not sufficient to overcome economic weakness and high share valuations in making it an attractive investment at this time. The Laclede Group (NYSE: LG ) is a St. Louis-based public utility holding company that operates both regulated and non-regulated natural gas distribution and marketing operations via wholly-owned subsidiaries. In addition to distributing natural gas to more than 1 million customers across its subsidiaries, the company also has 48 Bcf of natural gas and propane storage capacity. The Laclede Group has been on a buying spree in recent years, purchasing in-state peer, Missouri Gas Company, in 2013 and Alabama utility, Alagasco, in 2014. Both moves required it to greatly expand its debt load and caused its earnings to decline on a non-adjusted basis. More recently the acquisitions have begun to deliver earnings growth of their own, however, and the company’s share price is well above its 52-week low (see figure), defying broader sector performance. This article evaluates The Laclede Group as a potential long investment. LG data by YCharts The Laclede Group at a glance The Laclede Group distributes natural gas to customers via three regulated subsidiary utilities. The original is Laclede Gas Co., which is the largest natural gas distribution utility in the state of Missouri with 16,000 miles of main and service lines. It has 642,000 customers in St. Louis and east Missouri as well as 30 Bcf of natural gas and propane storage capacity and a propane vaporization facility. Missouri Gas Energy, which was purchased in 2013, provides natural gas to another 500,000 customers in Kansas City and west Missouri. Finally, Alagasco (aka Alabama Gas Corp.), which is the largest natural gas utility in the state of Alabama, distributes natural gas to 419,000 customers in 200 Alabama communities. The Laclede Group also operates several unregulated subsidiaries, the largest of which is Laclede Energy Resources, which provides non-regulatory natural gas services including marketing, and Laclede Pipeline Co., which transports propane between storage facilities in Missouri and Illinois. The regulated subsidiaries generate the overwhelming majority of the parent company’s earnings, however, reaching 98% in the TTM period. Laclede Gas Co. and Missouri Gas Energy both operate under the same favorable regulatory scheme. The Laclede Group has benefited from this consistency and reported a natural gas utility adjusted EPS CAGR of 14.8% between FY 2010 and FY 2014, with the increase being mostly driven by heavy investment in natural gas infrastructure. The holding company has reported adjusted EPS growth in four of its last five fiscal years, with flat growth being reported for the fifth year. This consistent performance goes back beyond the last five years, with The Laclede Group boasting 70 consecutive years of dividend payments, although its most recent performance has enabled it to provide 12 consecutive years of dividend increases. Its most recent increase of 4.5%, which was announced last November, resulted in a quarterly dividend of $0.46, or a 3.4% forward yield at the time of writing. The company targets a dividend payout ratio of 55%-65%, a range that it has largely maintained over the last five years even as its dividend as increased by 16% over the same period (see figure). LG Payout Ratio (NYSE: TTM ) data by YCharts FQ2 earnings report The Laclede Group reported the results of its fiscal Q2 for the period ending March 31, 2015, in May. The company reported revenue of $877.4 million, up 26.3% YoY, due to the fact that the Alagasco operations appeared on the latest quarter’s income statement. The result missed the consensus estimated by $90 million , however. The strongest performers were the subsidiary utilities, with natural gas utility revenue increasing by 53.5% YoY to $847 million, or 96.4% of total consolidated revenue as a result of the Alagasco acquisition. Natural gas marketing revenue fell by 49.4% compared to the previous year $30.4, however, mainly due to the presence of normal weather (FQ2 temperatures were 10% warmer YoY on average, albeit 6% colder than the long-term average) and lower natural gas prices in the most recent FQ2 than before. Operating income also rose strongly YoY to $157.7 million from $87.2 million. While much of this gain was again due to Alagasco, operating expense only rose by 18.5% YoY to $719.7 million, or $76.5 million less of an increase than was reported for revenue. The Laclede Group reported that its legacy operating income increased by $13.9 million compared to the previous year due to the introduction of new, more favorable rates in Missouri. Consolidated net income came in at $94.4 million, up 80% YoY from $52.2 million (see table). More importantly, EPS came in at $2.18, up from $1.59 the previous year despite the issuance of 11 million common shares to help finance the Alagasco acquisitions in the interim. Adjusted net income, which excluded $1.5 million in one-time acquisition-related expenses and $1.7 million in a fair value adjustment resulting from unrealized derivative losses, rose still higher to $97.6 million from $51.7 million YoY. Adjusted EPS (or “net economic earnings” in the company’s parlance) came in at $2.25 compared to $1.58 YoY, beating the consensus estimate by $0.12. The Laclede Group Financials (non-adjusted) FQ2 2015 FQ1 2015 FQ4 2014 FQ3 2014 FQ2 2014 Revenue ($MM) 877.4 619.6 222.3 241.8 694.5 Gross income ($MM) 394.6 254.4 (59.9) 192.5 289.2 Net income ($MM) 94.4 47.1 (14.9) 11.7 52.2 Diluted EPS ($) 2.18 1.09 (0.34) 0.33 1.59 EBITDA ($MM) 43.2 43.2 43.4 35.0 32.6 Source: Morningstar (2015). The company has been investing heavily in modernizing its existing distribution pipelines, resulting in much higher capex in the previous two quarters than before. It expects its FY 2015 capex to reach $300 million, with half of this being spent on pipeline replacement, up from $170 million in FY 2014. Due to the residual effects of the aforementioned debt increase and secondary equity offering, however, The Laclede Group ended FQ2 with $46.9 million, up from $10.9 million at the end of FQ2 2014. Its current ratio fell sharply over the course of the previous four quarters from 1.29 to 0.75, however, primarily due to a $290 million increase to short-term debt. While the current ratio isn’t nearly as important to regulated utilities with their steady cash flows than non-regulated firms, this is still something for investors to keep an eye on in coming quarters. Long-term debt increased by $903.2 million YoY to $1.7 billion to fund the Alagasco acquisition. Fortunately for investors, this investment yielded a 98% operating cash flow increase YoY, yielding a result of $314 million in the most recent quarter. Furthermore, the company has maintained fairly strong credit ratings ranging from BBB+ to A by S&P, and it has $750 million in consolidated liquidity available from existing credit facilities. $1.7 billion is also not an especially large debt load for a firm of the company’s size, mitigating concerns that rising interest rates later in the year could reduce its earnings. The Laclede Group’s most recent acquisition is more than capable of servicing the large debt taken on to complete it. Outlook The Laclede Group’s management had initially provided guidance of long-term adjusted EPS growth of 4% to 6%. The company now expects to exceed this pace in FY 2015 and possibly FY 2016 on a weather-normalized basis. This earnings growth is to be maintained via $1.5 billion in total capex through FY 2019, or $300 million in annual capex, mainly in the form of distribution infrastructure investment and expansion. The Laclede Group operates under two different regulatory schemes, both of which are favorable in their own ways. Missouri employs a traditional regulatory scheme under which rate cases are filed every three years. This lack of regulatory flexibility is offset by weather-normalization mechanisms and rapid recovery mechanisms for pipeline replacements, the latter of which allows The Laclede Group to recapture infrastructure upgrade costs every six months. The company should expect to quickly see its large planned pipeline replacement costs recaptured via higher rate bases through FY 2019 as a result. Alabama employs a very flexible regulatory scheme under which rate filings are made annually on a forward basis and multiple cost recapture mechanisms are provided. While this flexibility can result in lower allowed ROEs, the state’s scheme currently provides a substantially higher allowed ROE to Alagasco (10.8%) than Missouri provides to either Laclede Gas (9.7%) or Missouri Gas (9.8%). The Laclede Group’s overall achieved ROE has been a cause for concern of late. Missouri was hit hard by the Great Recession as its unemployment rate almost reached the double-digits and the company’s consolidated ROE ultimately peaked at 11.5% in FY 2011 before steadily declining. It didn’t even reach 7% in FY 2013 and FY 2014 and, while this was in part due to one-time acquisition costs that reduced non-adjusted net income, a period of non-existent earnings growth also was responsible. The Alagasco acquisition pushed this above 10% TTM on both adjusted and non-adjusted bases, indicating the wisdom of the move despite its risks. While it would be better still to see the company’s Missouri operations achieve ROEs closer to their allowed ROEs, Alagasco is positioned to drive overall earnings growth for The Laclede Group. This is ultimately important because both Missouri and Alabama have seen their economies weaken of late. The unemployment rate in both states recently increased and are now above the U.S. average after being well below it over the previous five years (see figure). Likewise, GDP growth in both states has slackened and their economies are no longer growing as quickly as the country’s (see second figure). This is especially a concern for the firm’s Missouri operations, as earnings growth disappeared on an adjusted basis when that state’s unemployment rate stabilized. It is too early to say that earnings growth from the Missouri operations will decrease, of course, but it is a potential concern for investors. Missouri Unemployment Rate data by YCharts Missouri Change in GDP data by YCharts Weather-related factors could cause the company’s Alabama operations to be an outsized contributor to its consolidated earnings in the coming quarters due to the presence of El Niño conditions. After missing an expected appearance in 2014, the phenomenon is now expected to be one of the strongest in the last 50 years this winter. El Niño events have historically been associated with above average winter temperatures in the northern half of the U.S. and below average temperatures in the southern half. NOAA reviewed historical events back in the 1990s and determined that Missouri experiences warmer-than-average temperatures in Q4 while Alabama experiences colder-than-average temperatures in Q1 during El Niños. The fact that all of The Laclede Group’s operations reside in the southern half of the country means that even record cold in Alabama would be unlikely to result in a tremendous surge to natural gas demand there, of course (a 47 degree F winter average temp is downright balmy for those of us raised in the Midwest), but it can be expected to boost demand. Whether this increase will offset reduced demand in Missouri remains to be seen, however, and it is possible that the net effect of El Niño on the company’s winter operations is zero. Valuation Analyst estimates for The Laclede Group have increased slightly over the last 90 days in response to the company’s better-than-expected FQ2 results. The FY 2015 adjusted EPS consensus estimate has increased from $3.16 to $3.17 while the FY 2016 estimate has increased from $3.35 to $3.38. Based on its share price at the time of writing of $53.64, the company is trading at trailing P/E ratios of 16.5x and 14.6x on non-adjusted and adjusted bases, respectively, and forward ratios for FY 2015 and FY 2016 of 16.9x and 15.9x, respectively. While lower than for some firms in the gas utilities sector, these ratios are all near the top of their respective 5-year ranges (see figure). The company’s share price does not appear to be undervalued at present, although expected earnings growth in FY 2016 prevents them from being clearly overvalued either. LG PE Ratio ( TTM ) data by YCharts Conclusion Acquisitions of peers in Missouri and Alabama provided natural gas utility holding company The Laclede Group with a substantial earnings boost in Q1 following a period of stagnation. Hindsight makes the latter investment in particular look positive due to Alagasco’s especially favorable regulatory scheme and the prospect of a colder-than average Alabama 2015/2016 winter resulting from a very strong El Niño event. This advantage could be offset by signs of economic weakness in both Missouri and Alabama, although it is too early to say whether or not this development will be sustained enough to negatively impact the company’s expected earnings growth. While consistent dividend growth, favorable regulatory schemes, and large planned capex provide support for management’s earnings growth guidance, conservative investors should require a margin of safety in the form of undervalued shares to compensate for the aforementioned economic weakness and The Laclede Group’s pre-acquisitions ROE weakness. Such a margin is not available at present, however, following share price strength, especially compared to the broader gas utilities sector over the last year. I recommend that potential investors wait for the share price to fall to 14x forward earnings ($47.32 based on the current FY 2016 estimate) before reevaluating the company as a potential long investment. Disclosure: I/we have no positions in any stocks mentioned, and no plans to initiate any positions within the next 72 hours. (More…) I wrote this article myself, and it expresses my own opinions. I am not receiving compensation for it (other than from Seeking Alpha). I have no business relationship with any company whose stock is mentioned in this article.