An Update On 4 Tactical/Momentum ETFs
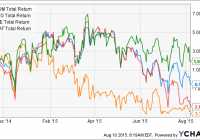
Summary Four tactical/momentum ETFs debuted in late 2014. These ETFs have the ability to switch between equities, bonds or other assets based on trailing momentum and/or volatility. How have these ETFs fared in the 9 months since inception? Introduction In a previous article , I discussed the debut of 4 tactical/momentum ETFs. Broadly speaking, these ETFs aim to exploit the momentum factor, which is often regarded as the premier anomaly due to its persistent outperformance over long periods of time. Stocks that have done well recently tend to continue to do well, while stocks that have done poorly recently tend to continue to do poorly. The momentum concept is embodied in aphorisms such as “Cut your losers and let your winners run.” Momentum works well not only within asset classes, but also between them. A momentum strategy that switches between stocks and bonds, for example (also known as “tactical” allocation), may well have allowed an investor to avoid the worst stock market crashes in history. A number of Seeking Alpha authors have presented various simple momentum strategies that have highly impressive backtested performance, such as varan , Frank Grossman and others. Recently, Left Banker described his own momentum strategy that had him reaping the rewards of treasury bonds in 2014. For investors who lack the time or inclination to implement their own tactical/momentum strategies, ETFs may be a valid alternative. Four such ETFs were launched in October or November of 2014. Cambria Global Momentum ETF (NYSEARCA: GMOM ) Global X JPMorgan US Sector Rotator Index ETF (NYSEARCA: SCTO ) Global X JPMorgan Efficiente Index ETF (NYSEARCA: EFFE ) Arrow DWA Tactical ETF (NASDAQ: DWAT ) For further details on the methodology of each of these ETFs, please see my previous article . Note that all four funds have the ability, at the minimum, to switch between equities and bonds. Hence, equity-only momentum funds, of which there are many, were excluded from this comparison. Given that it has been around 9 months since the debut of these four ETFs, I thought it would be a good time to assess their performance since their inception. Results The total return history of the four ETFs since the inception date of the newest fund (Nov. 2014) is shown below. GMOM Total Return Price data by YCharts The chart above shows that DWAT has had the highest total return of 1.94%, while SCTO has the lowest return of -3.33%. How does this compare with some of the most common benchmarks? The following 12 asset classes were selected as a comparison: U.S. equities (NYSEARCA: SPY ) Developed markets ex-U.S. equities (EAFE) Emerging market equities (NYSEARCA: EEM ) U.S. long-term treasuries (NYSEARCA: TLT ) U.S. intermediate-term treasuries (NYSEARCA: IEF ) U.S. investment grade bonds (NYSEARCA: LQD ) U.S. high-yield bonds (NYSEARCA: JNK ) Emerging market bonds (NYSEARCA: EMB ) U.S. real estate (NYSEARCA: VNQ ) Ex-U.S. real estate (NASDAQ: VNQI ) Commodities (NYSEARCA: DBC ) Global market portfolio (NYSEARCA: GAA ) The following bar chart shows the total return performances of the four tactical/momentum ETFs plus the 12 asset classes since Nov. 2014. The tactical/momentum ETFs are shown in green, equities in blue, bonds in red and other asset classes in yellow. We can see from the chart above that there has been quite a wide dispersion of return performances, with the highest being TLT at 6.35% and the lowest being DBC at -30.2%. The following chart is the same as that above except with DBC removed, in order to make the differences between the other funds easier to visualize. Discussion At first glance, it seems that the four tactical/momentum ETFs underperformed. U.S. stocks, as represented by SPY, returned 5.35% over the past 9 months, while the four U.S. bond ETFs averaged 1.57%. In contrast, the four tactical/momentum ETFs averaged only -1.19%. However, as Seeking Alpha author GestaltU has convincingly argued , a 60/40 U.S. stock/bond mix is not an appropriate benchmark for global tactical asset allocation [GTAA] strategies. Instead, the benchmark should be the investible global market portfolio [GMP]. This portfolio is nicely represented by the Cambria Global Asset Allocation ETF, ticker symbol GAA, which is the last asset class data point shown in the charts above. GAA returned -1.02% over the past nine months. This suggests that the four tactical/momentum ETFs did not significantly underperform this benchmark over the past nine months. Conclusions This article provides an update to four tactical/momentum ETFs that were launched around nine months ago. With domestic equities continuing to grind higher, many investors have been considering reducing their exposure to this space. For investors uncomfortable with market timing (like myself), the use of a tactical/momentum fund may allow investors to, in an ostensibly “passive” manner, stay invested in the outperforming markets such as the U.S. until the tide turns. However, this study also revealed a drawback of the tactical/momentum funds. None of these ETFs were apparently able to capture the full, or even any, upside of the domestic equity market (+5.35%) over the past nine months; in fact, as a group, the four ETFs exhibited a negative total return of -1.19%. This is especially surprising for SCTO (-3.33%), which invests only in U.S. sectors and/or U.S. short-term treasuries, and nothing else. Thus, investors should not expect the tactical ETFs to keep pace with the U.S. bull market, if it continues. Disclosure: I am/we are long GMOM. (More…) I wrote this article myself, and it expresses my own opinions. I am not receiving compensation for it (other than from Seeking Alpha). I have no business relationship with any company whose stock is mentioned in this article.

