Tag Archives: etf-hub

Australia’s Getting Comfortable At 2% Cash Rate And Is Expected To Maintain

Summary Australia’s last two rate decreases have begun to spur the economy. The RBA will likely cite progress and hold steady at the current 2 percent rate at the August policy meeting. Australia looks profitable in the long term, but the market will not react much to policy announcement. Why Australia Won’t Lower Rates Amid an environment of global easing, lowered interest rates and weakening currencies, Australia’s RBA will have a tough decision to make concerning its own interest rate at the monetary policy meeting on August 4. Over this past year, Australia has begrudgingly cut its rates twice in order to spur economic growth as a result of lowered domestic demand and weak job growth. Since its initial 25 basis point cut in February, the accommodative policy has spurred borrowing and lending, improved the housing market, and weakened the Australian dollar against the U.S. dollar. As the Australian dollar continues to decline, currently worth US74 cents, down 9.7 percent from the beginning of the year, we can expect to see an improving trade deficit and an accompanying natural economic stimulus to the labor market in the upcoming months. RBA Governor Glenn Stevens feels that this depreciation is good news for Australia – the boost is necessary for its economy to recover , especially considering the intense pressure on its inflation level due to lowering commodities prices. All of these factors will be taken into account when policy makers determine whether to maintain its 2 percent cash rate, or cut rates further. Given its current position, it is unlikely that Australia will feel the need to further spur the economy via monetary policy – at least in 2015. Instead, the announcement will likely cite the recent improvements and maintain steady rates, with the intention to further monitor data in upcoming months. While several analysts expect rates to dip down to 1.75 percent by the end of the year, that sort of cut doesn’t make sense over this timeline. Australia has not shown as much eagerness in resorting to these accommodative measures as Asia, Europe, and now Canada have; consequently, they are unlikely to jump to a third cut so soon. With the Federal Reserve expected to liftoff rates in September or early 2016, there is even more reason for Australia to wait out the clock and see how a U.S. tightening could impact both the exchange rate and exports. As a result, the RBA will most likely maintain its 2 percent rate at the August meeting. How To React When Australia lowered its cash rate in February, the Australian stock market saw an initial surge that led to a steady climb as investors began to feel more comfortable with the economy’s future prospects. The May announcement led to a similar initial surge, but was not followed by the steady climb, as the expected easing was mostly priced in over previous months leading up to the announcement. However, in June when the RBA maintained its current rate, the stock market hardly reacted, and instead, slightly dipped over those following weeks. In looking at this historical pattern, the market will likely not jump at the news of maintained policy, meaning it would not be a very profitable short-term investment. However, with the conditions slowly improving in Australia and an outlook that supports future growth, a long-term investment with Australian exposure would likely perform well over several years, as its policy is gearing it up for continued growth and stability. The iShares MSCI Australia ETF (NYSEARCA: EWA ): This Australian ETF closely tracks the Australian index with a beta of 1.02. While on an overall downward trend since January, it has ticked up 4.2 percent from opening to close of this past week. Disclosure: I/we have no positions in any stocks mentioned, and no plans to initiate any positions within the next 72 hours. (More…) I wrote this article myself, and it expresses my own opinions. I am not receiving compensation for it (other than from Seeking Alpha). I have no business relationship with any company whose stock is mentioned in this article.
Lipper Fund Flows: Domestic Equity Funds Lose While Markets Gain Ground

By Jeff Tjornehoj Stock markets rebounded this past week after Greece came back to the bargaining table with its creditors and acceded to even harsher demands than it had rejected a week earlier and after stocks in China appeared to slow their freefall. For the fund-flows week ended July 15, the Dow Jones Industrial Average climbed 535 points to end above 18,000 and regained ground it had lost over the prior three weeks of the Greek debt drama. Equity mutual fund investors withdrew an estimated $4.4 billion net for the week. Not surprisingly, they pulled money from domestic equity mutual funds (-$1.6 billion), which have been out of favor much of this year. Equity exchange-traded funds (ETFs) saw net inflows of $3.6 billion, although investors may have been taking profits, selling off financial services products (-$1.6 billion). The week’s biggest individual equity ETF recipient was the S PDR S&P 500 Trust ETF ( SPY , +$4.4 billion ) , while huge selling hit the F inancial Select Sector SPDR ETF ( XLF , -$1.5 billion ) and the iShares MSCI EAFE ETF ( EFA , -$975 million ) . Bond mutual fund investors continued to redeem shares of funds in Lipper’s High Yield Funds classification, which had net outflows of $272 million, while ETF investors in the same classification added a net $1.5 billion. Overall, taxable bond mutual funds saw net inflows of $473 million for the week. Mutual fund investors pulled some cash out of Core Bond Funds (-$234 million) and added a scant $97 million to Core Plus Bond Funds. Bond ETF investors pushed $2.2 billion into their accounts to create combined (mutual funds and ETFs) net inflows of $2.6 billion. The week’s top destinations for bond ETF investors were the iShares iBoxx $ High Yield Corporate Bond ETF ( HYG , +$1.0 billion ) and the SPDR Barclays Capital High Yield Bond ETF ( JNK , +$420 million ) . Municipal bond mutual fund investors pulled $75 million from their accounts for the eleventh weekly net outflows in a row. Money market funds saw net outflows of $9.4 billion, of which institutional investors pulled $9.3 billion and retail investors redeemed $100 million. Share this article with a colleague

Best3x4 Variable Asset System With Minimum Volatility Stocks Of The S&P 500

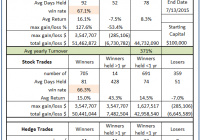
Summary This model can hold 3 to 12 stocks, at variable weightings, selected by a ranking system from a minimum volatility stock universe of the S&P 500. The model has 12 equally weighted slots; a very high ranked stock could occupy a maximum of 4 slots, that is a nominal 33% weighting of the model’s total assets. When adverse stock market conditions exist, the model reduces stock holdings by 35% and invests the proceeds in SDS. The backtest produced a simulated average annual return of about 36% from Jan-2000 to end of June-2015 with a maximum draw-down of minus 22%. The Minimum Volatility Stock Universe of the S&P 500 Minimum volatility stocks should exhibit lower drawdowns than the broader market and show reasonable returns over an extended period of time. It was found that a universe of stocks mainly from the Health Care, Consumer Staples and Utilities sectors satisfied those conditions. This minimum volatility universe of the S&P 500 currently holds 117 large-cap stocks (market cap ranging from $4- to $277-billion), and there were 111 stocks in the universe at the inception of the model, in Jan-2000. Trading Rules The ranking system employed is the same as for our Best8(S&P500 Min-Volatility) system, but the trading system differs in regard to the hedge used and some additional sell rules. The model assumes that stocks are bought and sold at the next day’s average of the Low and High price after a signal is generated. Variable slippage of about 0.12% of a trade amount was taken into account to provide for brokerage fees and transaction slippage. Buy Rules: Some of the largest market cap stocks are exclude from being selected. Sell Rules: Rank Keep the weight of a position in a slot to +10% and -15% of the nominal weight. Realized Trades Analysis An analysis of all the realized trades is shown in Table 1. There were 749 winning trades out of 1116, resulting in a win rate of 67.1%. The average yearly turnover was about 370%. On average a position was held for 78 days. Holdings The models can potentially hold a maximum of 12 different stocks, and a minimum of 3 different stocks. As of July 15 it held 8 different stocks with various weights as shown in Table 2. Performance In the figures below, the red graph represents the model and the blue graph shows the performance of benchmark SPY. The backtest period was 15.5 years, from January 2000 to June 2015. Figures 1 to 5 show performance comparisons: Figure 1: Performance 2000-2015 with market-timing and hedging with long SDS. The model uses a hedge ratio of 35% of current holdings during down-market conditions. (Note: The inception date of SDS was Jul-2006. Prior to this date values are “synthetic”, derived from the S&P 500.) Annualized Return= 36.1%, Max Drawdown= -21.8%. Figure 2: Performance 2000-2015 without hedging. Annualized Return= 34.2%, Max Drawdown= -22.9%. Figure 3: Performance 2000-2015 without hedging and market timing. Annualized Return= 27.8%, Max Drawdown= -49.8%. Figure 4: Performance Jan-2000 to Jun-2015 . Annualized Return= 39.7%, Max Drawdown= -21.5%. Figure 5: Performance Jul-2014 to Jun-2015. Total Return= 58.8%, Max Drawdown= -7.3%. This can be directly compared with our Best12(NYSEARCA: USMV )-Trader model’s return of 28.6% for the same time period. (click to enlarge) (click to enlarge) (click to enlarge) (click to enlarge) (click to enlarge) (click to enlarge) (click to enlarge) (click to enlarge) (click to enlarge) (click to enlarge) Figures 6 to 10 show performance details from Jan-2000 to Dec-2014 for the model with hedging and market timing: Figure 6: Performance versus SPY. Over the 15-year period $100 invested at inception would have grown to $9,170, which is 50-times what the same investment in SPY would have produced. Figure 7: 1-year returns. Except for 2006 the 1-year returns were always higher than for SPY. Figure 8: 1-year rolling returns. The minimum 1-year rolling return of the 3-day moving average was -5.8% early in 2007. Figure 9: Distribution of monthly returns relative to SPY. Figure 10: Risk measurements for 15.5-years and trailing 3-year periods. (click to enlarge) (click to enlarge) (click to enlarge) (click to enlarge) (click to enlarge) (click to enlarge) (click to enlarge) (click to enlarge) Following the Model This model can be followed, exclusively, live at iMarketSignals where it will be updated weekly together with our other trading models. It will not be available as a subscription model at Portfolio 123. Disclaimer One should be aware that all results shown are from a simulation and not from actual trading. They are presented for informational and educational purposes only and shall not be construed as advice to invest in any assets. Out-of-sample performance may be much different. Backtesting results should be interpreted in light of differences between simulated performance and actual trading, and an understanding that past performance is no guarantee of future results. All investors should make investment choices based upon their own analysis of the asset, its expected returns and risks, or consult a financial adviser. The designer of this model is not a registered investment adviser.