What Greece And China Teach Us About Investing
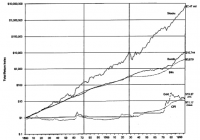
By Andy Rachleff It’s been a crazy couple of weeks for the investing world. China’s stock market – after one of the biggest run-ups of any market in history – has suffered a 40% collapse in just a few weeks. Greece has teetered on the brink of default, and still may or may not exit the euro. The U.S. has drawn up a major new deal with Iran, oil is down sharply, and Indian stocks are rallying like mad. What should an investor do? In a word: Nothing. If there’s anything that the day-by-day machinations of the market teach us, it is that slow and steady wins the race. The Incredible Mean-Reverting Nature of Stock Returns Investors have long known that staying the course is one of the most important things to do. Some of the best research on this topic comes from the so-called “Wizard of Wharton” – University of Pennsylvania professor Jeremy Siegel. In his New York Times bestselling book, ” Stocks for the Long Run ,” Siegel looked at the performance of equities from 1802 through 1997, the year the book was first published. His findings were astonishing: Despite the day-to-day volatility that we all feel, the actual long-run returns of stocks are remarkably consistent. Here’s how Siegel summarized his findings: ” Despite extraordinary changes in the economic, social, and political environment over the past two centuries, stocks have yielded between 6.6 and 7.2 percent per year after inflation in all major subperiods. The wiggles on the stock return line represent the bull and bear markets that equities have suffered throughout history. The long-term perspective radically changes one’s view of the risk of stocks. The short-term fluctuations in market, which loom so large to investors, have little to do with the long-term accumulation of wealth. ” His last line bears repeating: ” The short-term fluctuations in market, which loom so large to investors, have little to do with the long-term accumulation of wealth. ” Siegel found that almost no matter what period you looked at, stocks delivered about 7% after inflation. The Civil War, World War I, World War II, even the Great Depression (marked by the second black vertical line) were hiccups compared to the overall trend. The pattern repeats in other countries, including those that have experienced catastrophic collapses. World War II, for example, sheared 90% off the value of German equities… but German stocks completely rebounded by 1958, rising 30% per year, on average, from 1948 to 1960. They went on from there to new highs. Averaged out over the long haul, their return is a consistent 6.6% real return… a figure that continues through this day. The same is true for Japan, the UK, and all other markets that Siegel has studied; in the short run, volatility, but in the long run, profits. Can’t We Just Side-Step the Disaster Spots? Of course, the best possible outcome would be to steer clear of pullbacks, selling when markets are about to collapse and buying when they start to recover. This is the marketing pitch used by virtually every active manager in the world, and it is intuitively compelling. “Greece has been a disaster for years,” you can’t help but think. “Surely, if I had been paying attention, I would have sold and avoided its recent fall.” “China’s stock market was clearly a bubble,” you ponder. “The economy is slowing; reforms are stagnating; any idiot would have sold out before things got bad!” Unfortunately, the data shows that even highly-paid professionals are bad at sidestepping these pullbacks, and everyday investors are worse. As mentioned repeatedly on this blog, every piece of significant data shows that the vast majority of active mutual fund managers underperform the market over any meaningful period of time. Despite all their highly-paid analysts and fancy data services, they can’t beat a broad-based index. But the dirty little secret is, as bad as professional money managers are at beating the market, retail investors – on average – do worse. In a major study published in February 2015 , Morningstar looked at the difference between the average return of mutual funds and the actual returns that investors enjoyed. The data is brutal: While the average U.S. equity mutual fund returned 8.18% for the decade ending December 31, 2013, the average dollar invested in U.S. equity funds returned just 6.52%. For international equity funds, the situation was worse: an 8.77% return for the average fund, but a 5.76% return for investors. (click to enlarge) John Reckenthaler, the vice president of research at Morningstar, explained what was happening in Barron’s last year. “The problem,” the magazine wrote, summarizing his comments, “is that investors tend to get in and out of an asset class at the wrong time.” In other words, we tend to buy high and sell low. The problem is worse in the more volatile asset classes, ostensibly because we’re more likely to panic. (It’s not just Morningstar. DALBAR conducts an annual study that looks at the same effect over rolling twenty-year periods. Its last finding shows that investors underperformed the market by 4.2% per year over the past twenty years.) Don’t Buy What They’re Selling The reason we don’t hear much about the power of long-term investing – and the truth about the futility of trading – is that long-term investing is boring and it’s cheap. The financial media thrives by encouraging you to panic, and large parts of the financial industry make money only when you act. Big moves sell newspapers, and high trading activity means commissions for online brokers. The only people who don’t profit from that activity are investors themselves, because as it turns out, we can’t predict the future. Even as we finalize this post, Greece is possibly stabilizing, Chinese stocks have evened out and the crisis-du-jour involves gold. Did you see that coming? Do you know what comes next? It’s hard to stare down a significant market correction and stick to your plan. When the US government shut down in September 2013 during the budget showdown, we saw a large number of clients refrain from continuing to add deposits. They paid handsomely for missing out on the rebound. If you invest regularly, harvest your losses and rebalance your portfolio, you’ll end up benefiting from market corrections in multiple ways. It won’t be easy. But over the long haul, it will really pay off. For more on this topic please read: Stay the Course, Even While You’re Down There’s No Need to Fear Stock Market Corrections Invest Despite Volatility Disclosure Nothing in this article should be construed as a tax advice, solicitation or offer, or recommendation, to buy or sell any security. While the data Wealthfront uses from third parties is believed to be reliable, Wealthfront does not guarantee the accuracy of the information. The analysis uses information from third-party sources, which Wealthfront believes to be, however Wealthfront does not guarantee the accuracy of the information. There is a potential for loss as well as gain. Actual investors on Wealthfront may experience different results from the results shown. Andy is Wealthfront’s co-founder and its first CEO. He is now serving as Chairman of Wealthfront’s board and company Ambassador. A co-founder and former General Partner of venture capital firm Benchmark Capital, Andy is on the faculty of the Stanford Graduate School of Business, where he teaches a variety of courses on technology entrepreneurship. He also serves on the Board of Trustees of the University of Pennsylvania and is the Vice Chairman of their endowment investment committee. Andy earned his BS from the University of Pennsylvania and his M.B.A. from Stanford Graduate School of Business.

