Tag Archives: etf-hub

Best And Worst Q3’15: Energy ETFs, Mutual Funds And Key Holdings

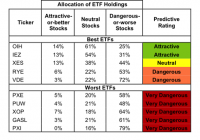
Summary The Energy sector ranks last in Q3’15. Based on an aggregation of ratings of 20 ETFs and 90 mutual funds in the Energy sector. OIH is our top-rated Energy ETF and FSESX is our top-rated Energy mutual fund. The Energy sector ranks last out of the 10 sectors as detailed in our Q3’15 Sector Ratings for ETFs and Mutual Funds report. It gets our Dangerous rating, which is based on aggregation of ratings of 20 ETFs and 90 mutual funds in the Energy sector. See a recap of our Q2’15 Sector Ratings here . Figures 1 and 2 show the five best and worst-rated ETFs and mutual funds in the sector. Not all Energy sector ETFs and mutual funds are created the same. The number of holdings varies widely (from 25 to 163). This variation creates drastically different investment implications and, therefore, ratings. Investors seeking exposure to the Energy sector should buy one of the Attractive-or-better rated ETFs or mutual funds from Figures 1 and 2. Figure 1: ETFs with the Best & Worst Ratings – Top 5 (click to enlarge) * Best ETFs exclude ETFs with TNAs less than $100 million for inadequate liquidity. Sources: New Constructs, LLC and company filings The PowerShares Dynamic Oil & Gas Services Portfolio ETF (NYSEARCA: PXJ ) is excluded from Figure 1 because its total net assets are below $100 million and do not meet our liquidity minimums. Figure 2: Mutual Funds with the Best & Worst Ratings – Top 5 (click to enlarge) * Best mutual funds exclude funds with TNAs less than $100 million for inadequate liquidity. Sources: New Constructs, LLC and company filings The Market Vectors Oil Services ETF (NYSEARCA: OIH ) is the top-rated Energy ETF and the Fidelity Select Energy Service Portfolio (MUTF: FSESX ) is the top-rated Energy mutual fund. OIH earns our Attractive rating and FSESX earns our Neutral rating. The PowerShares DWA Energy Momentum Portfolio ETF (NYSEARCA: PXI ) is the worst-rated Energy ETF and the Saratoga Energy & Basic Materials Fund (MUTF: SBMBX ) is the worst-rated energy mutual fund. Both earn a Very Dangerous rating. 187 stocks of the 3000+ we cover are classified as energy stocks. National-Oilwell Varco (NYSE: NOV ) is one of our favorite stocks held by Energy ETFs and mutual funds and earns our Very Attractive rating. Since 2009, National Oilwell has grown after-tax profit ( NOPAT ) by 11% compounded annually. National Oilwell has a return on invested capital ( ROIC ) of 10% and over $4 billion in free cash flow on a trailing twelve-month basis. Due to the recent decline in energy-related securities, NOV can be purchased well below its fair value. At its current price of ~$43/share, NOV has a price to economic book value ( PEBV ) ratio of 0.6. This ratio implies that the market expects National Oilwell’s NOPAT to permanently decline by 40%. If National Oilwell can grow NOPAT by just 3% compounded annually for the next six years , the stock is worth $80/share today – an 86% upside. Marathon Petroleum Corp (NYSE: MPC ) is one of our least favorite stocks held by Energy ETFs and mutual funds and earns our Very Dangerous rating. Marathon’s NOPAT has declined from $3.3 billion in 2011 to -$589 million in 2014. ROIC has also fallen from 15% to 1%. Investors not reading the footnotes would be unaware of the deteriorating business fundamentals. Due to a change in LIFO inventory value we remove $3.4 billion from Marathon’s 2014 income statement. Without making this adjustment the market has been led to believe that profits actually grew in 2014. The disconnect between NOPAT and net income could explain why MPC is up 39% over the last year despite the Energy sector being down 27%. To justify its now overvalued price of $56/share, MPC must grow revenues by 16% compounded annually for the next 13 years while also raising its current NOPAT margin from -0.6% to 2.5%. Marathon has only grown revenue by 8% compounded annually since 2011. Expecting Marathon to double its revenue growth in a weak Energy environment and maintain that high level for over a decade seems rather optimistic. Figures 3 and 4 show the rating landscape of all Energy ETFs and mutual funds. Figure 3: Separating the Best ETFs From the Worst ETFs (click to enlarge) Sources: New Constructs, LLC and company filings Figure 4: Separating the Best Mutual Funds From the Worst Mutual Funds (click to enlarge) Sources: New Constructs, LLC and company filings D isclosure: David Trainer and Allen Jackson receive no compensation to write about any specific stock, sector or theme. Disclosure: I/we have no positions in any stocks mentioned, and no plans to initiate any positions within the next 72 hours. (More…) I wrote this article myself, and it expresses my own opinions. I am not receiving compensation for it. I have no business relationship with any company whose stock is mentioned in this article.
Income ETFs, Funds And MLPs: Tide Going Out

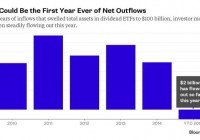
Low interest rates, relentless central bank confidence pumps and a runaway investment sales machine have all served to herd income-searching investors into income-producing assets over the past 3 years. In the process, unit valuations that were already high in 2012 moved to outrageous by 2014. The trouble is that capital risk rises in lock step with price, even as income products have been sold to those who can least tolerate losses. The marketing mantra is that income/dividend paying securities are ‘defensive,’ ‘stable’ places to park savings. Just as in previous investment cycles, fund cos and issuers ramped up sales campaigns as prices rose, rolling out an ungodly barrage of artfully wrapped products. Sadly many customers who had bitten similar baits in 2005-08, lost heavily and swore off the risk-sellers for a few years after that. Then in the past couple of years as finance trolled for suckers, many hopefuls have been lured back in, just as the price cycle crested once more. Some of the most reckless financial advisers and firms (unfortunately, there’s lots of them) have been looking after their own sales targets by recommending that their customers borrow to “invest.” With loan rates so low, they argue it’s a no-brainer to use a lender’s money to increase buying power. In truth, the strategy is more typically a recipe for financial disaster. The fall out of this cycle is just starting to show as high yield debt, preferred shares and MLPs (Master Limited Partnerships) concentrated on the energy sector, have been selling off over the past 9 months. See: MLPs yield headaches for advisers who bought them for income. The capital tide is retreating. As usual it starts slowly at first; then all at once, as losses shock the hearts and minds of holders. See: Is this the beginning of the end for dividend funds? Dividend ETFs are on fire, and not in a good way. Exchange-traded funds that employ a variety of strategies to invest in dividend-paying stocks have been a no-brainer since the financial crisis, as income investors have confronted artificially low interest rates. But after years of inflows that swelled assets to $100 billion, dividend ETFs have seen an outflow of $2 billion this year.1 If that isn’t quite apocalyptic, it is scary, and if it keeps up, this will be the first year of outflows ever. The outflows aren’t from just one ETF or the result of one massive trade. It’s a slow and steady burn from most of the largest and most beloved dividend ETFs. (click to enlarge) When dividend products from the Big Three in ETFs – Vanguard, BlackRock, and State Street – are hurting, it shows that no product is safe when investors anticipate a big change in the markets. Not even dividend ETFs.

Homebuilder ETFs Soar On Hot-Selling Homes

There is midsummer madness in the housing market thanks to soaring demand for homes. This is especially true as existing home sales jumped at the fastest pace in eight years in June while median home prices hit a record high. U.S. existing sales climbed 3.2% to a seasonally adjusted annual rate of 5.49 million homes and much higher than the market expectation of 5.4 million. This represents the highest reading since February 2007. Meanwhile, median home price surged 6.5% year over year in June, well above the July 2006 peak on limited supply. Robust numbers reflect a brisk summer selling season and were credited to an improving economy, accelerating job growth, rising wages and the prospect of a interest rates hike later in the year. This has led to a rally in the homebuilder space. In particular, Hovnanian Enterprises (NYSE: HOV ), D.R. Horton (NYSE: DHI ), PulteGroup (NYSE: PHM ), Beazer Homes (NYSE: BZH ), and Lennar Corporation (NYSE: LEN ) are up 3.6%, 2.8%, 2.4%, 2.3%, and 2.3%, respectively. Smooth trading has also been felt in the homebuilder ETFs space, with iShares U.S. Home Construction ETF (NYSEARCA: ITB ) and SPDR S&P Homebuilders ETF (NYSEARCA: XHB ) gaining about 2% each on the day. From a year-to-date look, ITB and XHB are up 6.1% and 7.1%, respectively, and are easily outpacing the broad sector (NYSEARCA: XLB ) and broad market (NYSEARCA: SPY ) funds. XLB lost nearly 3% while SPY gained 3.8% in the same time frame. Both the homebuilder ETFs have a decent Zacks ETF Rank of 3 or ‘Hold’ rating with a High risk outlook. The upside in the homebuilder stocks was also supported by last week’s solid data including housing starts and building permits. New home construction jumped to the second-highest level since November 2007 in June while building permits surged to a near eight-year high, suggesting that housing market recovery is on high gear. Further, homebuilder confidence, as indicated by the National Association of Home Builders/Wells Fargo housing market index, remained steady at 60 in July. This marks the maximum confidence in a decade for two consecutive months. The outperformance in the homebuilding space is likely to continue in the coming months given that the residential and commercial building industry has a solid Zacks Rank in the top 40%. Investors seeking to make large profits in a short span could take look at the leveraged play – ProShares Ultra Homebuilders & Supplies ETF (NYSEARCA: HBU ) – which provides double exposure to the index of ITB. However, the fund is relatively new in the space and has low trading activity, making it a riskier and high cost choice. Original Post