Tag Archives: etf-hub

Pursuing Smart Beta: Multi-Factored ETFs

Summary Both iShares and Global X have recently issued ETFs based on selecting holdings using complex systems of implementing “smart beta.” iShares’ “FactorSelect” funds use a complex system of factors to select high-quality holdings. Global X’s “Scientific Beta” funds use a complex weighting system to develop a portfolio that will perform optimally. In June, I wrote about the iShares FactorSelect MSCI International ETF (NYSEARCA: INTF ), an ETF with an inception date of April 28, 2015. 1 iShares introduced four other funds on that same date: the iShares FactorSelect MSCI Intl Small-Cap ETF (NYSEARCA: ISCF ), the iShares FactorSelect MSCI Global ETF (NYSEARCA: ACWF ), the iShares FactorSelect MSCI USA ETF (NYSEARCA: LRGF ) and the iShares FactorSelect MSCI USA Small-Cap ETF (NYSEARCA: SMLF ); as the names would suggest, all of the funds have something in common: they are based on the FactorSelect strategy. Shortly after the iShares releases (May 12, to be exact), Global X Funds issued four ETFs of its own: the Global X Scientific Beta U.S. ETF (NYSEARCA: SCIU ), the Global X Scientific Beta Europe ETF (NYSEARCA: SCID ), the Global X Scientific Beta Asia ex-Japan ETF (NYSEARCA: SCIX ), and the Global X Scientific Beta Japan ETF (NYSEARCA: SCIJ ). Again, as the names suggest, all four ETFs are based on the same ( Scientific Beta ) strategy. Both series of funds represent efforts by their respective issuers to provide investors with a “bridge” between – or perhaps better: an alternative to – actively managed funds and purely passive funds. 2 I thought it might be interesting to take a look at the two sets of offerings and their underlying strategies; there are interesting similarities between the approaches, as well as some significant differences. FactorSelect BlackRock’s (NYSE: BLK ) approach to Smart Beta involves a (proprietary) model that selects companies for a given fund on the basis of four factors: 3 Value : a score is derived from a company’s valuation, using measures such as price/book value, forward share price to earnings, enterprise value to operating cash flow, etc. Quality : a score is computed using a company’s metrics (return on equity, debt/equity, earnings variability, etc.). Momentum : the score is a composite of the security’s relative performance against the global market (for two years), and against securities based in the same country (for six months and twelve months). Low Size : the score is a measure of a company’s market capitalization compared to companies based in the same country. The final score is a composite of the four factors, which are modified-capitalization weighted. The funds are rebalanced/reconstituted semi-annually. Scientific Beta As with BlackRock, Global scores its potential holdings on the basis of four factors, although each factor has a single definition, rather than being an aggregate of several “sub-factors.” 4 , 5 Thus: Value : Price to Book Size : Market Capitalization Low Volatility : 104-week historical volatility Momentum : last 52-week total return, excluding most recent month. Unlike BlackRock’s modified-cap-weighting scheme for its factors, Global employs a more complex weighting system incorporating five schemes: 6 Maximum Deconcentration : equal weights to minimize firm-specific risk. Maximum Decorrelation : minimizes volatility based on historical correlations between holdings. Diversified Risk Weighted : volatility and weight are inversely correlated (greater volatility gets lesser weight) Efficient Minimum Volatility : minimize portfolio volatility based on both correlations and volatilities. Efficient Maximum Sharpe Ratio : maximize risk-adjusted performance based on expected returns and volatilities. The funds are rebalanced/reconstituted quarterly. Comparison In essence, both sets of funds mimic an actively managed fund by introducing complex selection and weighting criteria. The use of complex criteria adds a discretionary element to holdings selection, while at the same time providing the same level of transparency that is typical of an index fund. The difference between the two sets of holdings is in the focus of the complexity they introduce, with iShares introducing the complexity in the scoring factors and Global using a complex weighting schema. I will argue that while their approaches are different, the results may – at least intuitively – be quite similar. 7 Factors Both sets of funds look at a company’s size , value and momentum . Where they differ, iShares factor involves data reflecting a company’s quality , while Global factors the volatility of a company’s stock. But even where the two series “agree,” the agreement is in name only. Global defines its factors very narrowly, choosing a single characteristic, ratio or formula for each factor, while the iShares funds’ factors are complex aggregates. The difference in factor composition is perhaps most starkly exhibited in terms of stock value . It is difficult to accept that one can determine the valuation of a company on a single metric, particularly price-to-book. 8 Finding a realistic way to combine a set of valuation data to arrive at a reasonable value seems more adequate. Both funds incorporate size in their factoring, where they seek to avoid selecting large companies. Statistically, smaller companies realize more growth than large companies do, so in the interest of maximizing portfolio growth potential both fund series place greater value on the smaller companies. It is with regard to size that both companies structure their portfolios differently. iShares divides its FactorSelect funds according to U.S., ex-U.S. Developed, and Global focuses, with the first two subdivided between large- and mid-cap portfolios on the one hand, and small cap portfolios on the other. Global structures its four portfolios to include all market caps in each. Momentum is an interesting case, with Global focusing on a company’s total returns over 52 weeks, while iShares considers a company’s performance in relation to ((a)) global stocks over two years, and ((b)) same-country companies over six- and 12- month periods. Thus, while Global is looking at each company individually, iShares evaluates companies in the context of global and national trends – a more dynamic picture of how well a company is doing. I must admit to a little dismay that Global does not take fundamentals into account. One of iShares’ factors (quality) is essentially a composite of a company’s fundamental data, and would seem to be (at least to my view) much more important in evaluating a company’s prospects than low volatility, which replaces fundamentals in the Global schema. Moreover, and as we will see next, volatility plays an important role in Global’s weighting schema – using it in two phases of its selection process would seem excessive to its overall importance. Weighting Comparison While iShares’ factors are complex aggregates, the series becomes somewhat one dimensional in terms of its weighting system, which is a “modified market-cap weighting,” the weight a holding receives being its capitalization influenced by its overall factor score. Global’s factors may be one dimensional, but its weighting system is decidedly not. Global’s five-element weighting process is designed to identify correlations and volatilities in its portfolio, adjusting the weighting of its holdings (from an initial equalized weighting) to compensate for intra-portfolio correlations and minimize overall portfolio volatility. Finally, weighting is adjusted according to the companies’ Sharpe Ratios. Assessment In general, the primary difference between the two sets of funds seems to be that the iShares FactorSelect funds have portfolios that are constituted very selectively, while the Global X Scientific Beta funds have portfolios that are balanced for optimal performance. It will be interesting to see which series fares better over time from this perspective, but I do not see enough significance in this difference to recommend one series over the other. 9 Both systems are crafted to produce a portfolio that should exhibit excellent growth patterns, although they accomplish that goal differently. What is significant is the focus of each fund in both series. Global has developed funds that are geographically specific – one for the U.S., one for Europe, one for Japan and one for “non-Japan” Asia. If the investor is interested in a nicely balanced portfolio for a specific region, the Scientific Beta series makes for an attractive option. The iShares funds, on the other hand, constitute very selective groups of companies that provide excellent growth potential – at least, in principle. The funds are differentiated according to the extent of that potential: the relative safety of mid- to large-capped holdings or the greater potential growth of small caps; they are further differentiated by whether the holdings are domestic or international. The investor is choosing an equity category only broadly differentiated regionally. As I mentioned in my article on INTF, I have been really reluctant to commit to an international ETF. INTF is the first fund that has appealed to me in terms of its selectiveness and the range of its holdings. The fund has enabled me to add solid international holdings to my portfolio while making me feel confident that the foreign holdings are high quality companies with good growth prospects. Disclaimers This article is for informational use only. It is not intended as a recommendation or inducement to purchase or sell any financial instrument issued by or pertaining to any company or fund mentioned or described herein. All data contained herein is accurate to the best of my ability to ascertain, and is drawn from the Company’s Prospectus, Statement of Additional Information, and fact sheets. Data from any other sources (if used) is cited as such. All opinions contained herein are mine unless otherwise indicated. The opinions of others that may be included are identified as such and do not necessarily reflect my own views. Before investing, readers are reminded that they are responsible for performing their own due diligence; they are also reminded that it is possible to lose part or all of their invested money. Please invest carefully. 1 ” INTF: An Ideal Basket Of International Equities ,” Seeking Alpha , June 9, 2015. 2 Both companies specify that their strategies are intended to provide viable alternatives to actively managed funds while outperforming the simple indexed funds. 3 These factors are described in detail in the prospectuses(under “Principal Investment Strategies”) for each of the funds. All five funds apply the same factors, each fund applying them to a specific regions/market capitalization. The calculations in the model are proprietary to MSCI, which develops the underlying index for the funds. 4 Global X Scientific Beta ETFs Family Guide , available here . 5 A detailed discussion of the construction of the indices used by Global X can be found in ERI Scientific Beta Equity Strategy Construction Rules , by the EDHEC-Risk Institute . 6 Scientific Beta ETFs Family Guide . 7 Similar, at least, in terms of ultimate approach, although not necessarily in terms of actual portfolio content. 8 I am a big fan of price-to-book value. It is a great indicator of value, and I regularly look at companies that have P/Bs less than 1 – these are companies where the value of the actual assets of the company exceed the value of the shares. In the event of a bankruptcy, shareholders of such a company would, in principle, receive more money for their shares than they paid. However, I would not rely on P/B as the determinant of a company’s overall value. 9 Actually, I do, but it is a matter of personal preference, rather than rigorous analysis. The FactorSelect process seems more comprehensive, indicating a greater level of sensitivity to the strength (both fundamental and displayed) of the companies of which the portfolio is comprised, while the Global X Scientific Beta system – while rich in its weighting system – seems rather sparse in selectiveness. The result of the latter system is a portfolio that may be well-balanced, but I am less confident in the components of that portfolio. Disclosure: I am/we are long INTF. (More…) I wrote this article myself, and it expresses my own opinions. I am not receiving compensation for it (other than from Seeking Alpha). I have no business relationship with any company whose stock is mentioned in this article.
The Beginner’s Guide To Volatility: ZIV

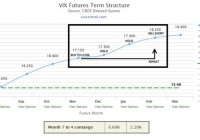
Summary We will cover the basics of ZIV. Examples of trading strategies for the mid-term futures. Current advice on ZIV. Welcome to the final part of The Beginners Guide to Volatility. I highly encourage you to view the two articles below, unless you have already read them. Some terms in this article were previously explained in the first two parts. Part One: The Beginner’s Guide To Volatility: VXX Part Two: The Beginner’s Guide To Volatility: XIV VelocityShares Daily Inverse VIX Medium-Term ETN (NASDAQ: ZIV ) This article will focus on the mid-term VIX futures. To be clear, these products are not the same as the short-term futures products we have discussed before. Some things are similar and others are very different. As a basis for discussion, we will use the inverse product ZIV. I really don’t recommend any other mid-term futures products. What are the mid-term futures? How would an inverse fund operate in the mid-term futures? See below: (click to enlarge) The mid-term futures span months four through seven. An inverse fund, which means in reverse order, sells short month seven’s contract. The fund will hold that contract (short) until selling it when it reaches month four. This process typically takes about 90 days depending on the month and expiration date of the VIX futures. As you may recall from the previous two articles, VIX futures are not the VIX Index and they trade independently of the market and level of stock prices. If you are on vixcentral.com, below the individual months you will see the month seven to four contango box. I have edited this into the above graphic. The first box represents the total percentage of contango or backwardation from month seven to four. For more on these terms, please view the first two articles in this series. The second box represents the estimated amount of contango or backwardation you could expect to profit/loss from during the next 30 days. It takes the first box and divides it by three. Again this is just an estimate. Contango/Backwardation in Mid-Term Futures Charts above and below made by Nathan Buehler using data from The Intelligent Investor Blog . Below, you will see an overlay of ZIV using the same time values to give you a clearer view of the data: Context It is important to view the above chart to put the mid-term futures into context. Although the data is back-tested, it is still relevant and useful. Had you viewed the current data alone (see below), it would appear mid-term future rarely go into backwardation. For the most part, this is true; however, you should be aware of negative economic events that would cause a deeper and more prolonged trek through backwardation. (click to enlarge) Why Consider Inverse Mid-Term Futures? Inverse mid-term futures provide a less volatile bet on decreasing volatility and/or sideways to rising markets. The best reward for your risk would be investing in these products after a dramatic and prolonged spike in the mid-term VIX futures. Historically, investing in mid-term futures now would give you a high risk and minimum reward scenario. See below for an example of a winning strategy: Winning Strategy: Let’s review two strategies that would work well. Buy ZIV once futures re-enter contango from backwardation. Risk of backwardation reappearing. Wait for backwardation and buy ZIV once 5% contango is reached. Visual (click to enlarge) Let’s go over the positives, negatives, and key takeaways with this strategy. Positives: Mid-term futures are already less volatile and less risky than short-term futures. This strategy, especially strategy two, is conservative in managing risk. Negatives: With strategy one, futures could reenter backwardation causing large losses. This opportunity will only occur once a year on average. Some periods may go longer without seeing backwardation present in the mid-term futures. It has been almost four years since the mid-term futures were in backwardation. Takeaways: Your focus on this decision should be in the strength of the U.S. economy and the ever more important global economic impact on the U.S. You need a positive economic outlook and improving or stable economic conditions for this to work as intended. Liquidity One thing you will notice about ZIV in comparison to short-term futures products is the drastically lower volumes. Average volume over the past three months is about 62,000, representing around $2.5-$3 million in transactions per day. As of writing, the fund has $123 million in assets under management (AUM). This represents about 2% of the fund being traded per day. When compared with the ProShares Ultra VIX Short-Term Futures ETF (NYSEARCA: UVXY ) that fund had about $342 million in AUM, and with its near-term average volume of 12 million shares, that represents around $360 million or over 100% of the assets in the fund being traded per day. ZIV will attract investors that are not looking for a day trade and have more of a buy-and-hold or longer-term view of the market. The low volume does not make this an illiquid investment. Conclusion The inverse mid-term VIX futures offer you another way to invest in volatility. It is a much slower pace than the short-term futures but also carries a more moderate level of risk if backwardation persists for a long period of time. Should things turn south, this product is much more forgiving in allowing you to exit a position. Short-term products often react much worse to immediate events. Now is not an opportune time to invest in the mid-term futures, but this article should have given you a good indication of what conditions would look like when the opportunity arises. I appreciate you reading this series, and I hope it continues to serves as a foundational education piece for volatility investors for years to come. My best advice is to fully educate yourself before investing in any VIX-related products. Knowledge is power and very important with this asset class. Disclosure: I/we have no positions in any stocks mentioned, and no plans to initiate any positions within the next 72 hours. (More…) I wrote this article myself, and it expresses my own opinions. I am not receiving compensation for it (other than from Seeking Alpha). I have no business relationship with any company whose stock is mentioned in this article.

Cash: The Forgotten Asset Class

Summary Many responsible for portfolio construction forget the important role that cash plays in an overall investment portfolio. Cash plays several roles given divergences in the economic data and environment the investor is operating in, but I believe, some level of cash should be kept in all environments. Currently investors are earning close to 0% on cash, and alternative investments for cash are explored. Many investors have lamented at the lack of investment options for excess cash, and with good reason. Since the Fed began their extraordinary monetary policy which has included interest rates at the zero lower bound, savers have been deprived of a reasonable rate of interest on their cash savings. Most bank accounts currently pay 0.01%. This begs the question where should savers put their cash to earn a reasonable rate of return, while preserving the safety of principal? While there are few places to get the traditional 5% money market of the pre financial crisis era, there are several options for investors to park their cash to earn additional alpha. (click to enlarge) Reasons to Keep Cash The common theme on Wall Street is to have as little cash as possible. Today, many financial gurus are telling investors to keep 100% equity portfolios, as many expect the Fed to raise interest rates, and have instilled unnecessary fear into investors’ minds about bonds. As we will explore there are many reasons investors can, and should, keep cash on hand. Keeping Cash to Stay the Course As I discussed in my piece, the key to long term investment success keeping a certain percentage of ones assets in cash allows investors to stay the course in investing. As the financial crisis has shown many investors routinely say they can handle more risk than they can in a real life scenario. This disconnect between risk tolerance, the attitude towards risk, and risk capacity, the ability to actually withstand risk, is the reason that all too often an investor is their own worst enemy as they take money out of risk assets at the first hint of trouble. By keeping more safe assets on hand, investors can ride out the storms of the market and reach their long term investing goals. Keeping Cash to Take Advantage of Market Opportunities Market draw downs are not fun for the average investor. But as Bruce Berkowitz of Fairholme Capital says, market declines set up the environment for future outperformance. In addition to staying the course in the pursuit of achieving ones long term investment goals, having cash on hand, allows investors to take advantage of rock bottom prices on risk assets when the time is right. Yet another reason why the advice of the crowd, staying fully invested in equities, makes little sense. Keeping Dollar Bills in a Deflationary Environment In a deflationary environment, the value of the dollar increases in buying power. An investor keeping cash may be earning little return on their cash in the form of interest but is earning a great return in the real economy, as every dollar is worth more and more in buying power. As you can imagine this works the other way when we are talking about debt. In a deflationary environment, debt holders are strangled as every dollar owed increases in value. Keeping cash piles high and debt burdens low is imperative to profiting in a deflationary environment. An Overview of the Current Economic Environment In order to understand cash as an investment we have to first understand the current economic environment. This allows us to understand the role cash plays within the current context of portfolio construction. As I stated in The Key to Investment Success , holding cash and U.S. Treasury Securities, which are one in the same, is imperative to achieving ones long term investment objectives. However, the amount of cash held is subject to an analysis of the economic environment. Currently, the economic data continues to worsen it seems with virtually every data release from around the globe. Two weeks ago Singapore was expecting a positive increase to GDP of 0.8% instead GDP fell sharply at a rate of 4.6%. Just this past week we learned that South Korea has had its slowest GDP growth in six years. The challenges in China with slowing GDP growth and crashing stock markets are bringing even more uncertainty to the forefront. The debt crisis in Greece, and the continued over indebtedness of the Eurozone, and the United States continues to provide a drag on GDP that no one seems to be doing anything about. The data stateside is not bringing much confidence to the market place that our economy is capable of handling the eagerly anticipated rise in interest rates that the street has told us is coming as early as September. (click to enlarge) (click to enlarge) (click to enlarge) Velocity on M2 remains at a 50+ year low, u-6 unemployment remains elevated at 10.5%, the PCE, the Fed’s preferred measure of inflation, remains below the target of 2%, commodities are falling precipitously, and productivity in the U.S does not look good. We are nearly seven years into a recovery and yet the U.S continues to grow at an anemic 2.2% average. In my recent piece, Don’t Ignore The Weakness in Commodities , I argued that the slip in commodity prices is really indicative of a worldwide slowdown in economic growth, and rising deflationary forces. As both the public and private spheres are taking on more and more debt, there is simply less demand for goods and services. With this lack of demand and oversupply, we are seeing prices decline. In this type of economic environment holding sufficient levels of cash, and even being overweight cash and cash equivalents, such as U.S Treasury Bonds, is a prudent investment strategy in my opinion. Alternative Investment Strategies to Boost the Return on Cash There are many alternatives to boost the return on cash, but first we must remember that the objective of the cash sleeve of a portfolio is to provide stability and return OF our capital not to maximize return ON our capital. With that in mind here are three strategies to maximize the return on cash. Active Management Short Term Funds Some investors should consider the benefits of actively managed short term funds such as the PIMCO Enhanced Short Maturity Strategy ETF (NYSEARCA: MINT ). MINT is a fund that holds bonds with durations that generally do not exceed one year, with the objective of enhancing the return on capital to be greater than a money market fund. Currently MINT boasts a 1.64% yield to maturity, and an SEC yield of 0.73%. However it does carry an expense ratio of 0.35%, which I would consider a bit steep for a place to park cash. Mutual fund alternatives may be the Dodge & Cox Income Fund (MUTF: DODIX ) or the Fidelity Tax Free Bond Fund (MUTF: FTABX ) for taxable account investors. U.S. Treasury Securities My perennial favorite place to park cash is in U.S. Treasury securities, which can be bought in a variety of maturities allowing the investor to lock in higher rates for a longer period of time in a declining rate environment, or give them the opportunity to reinvest maturing securities at higher rates in a rising rate environment. In the current environment, I continue to be partial to the long term Zero Coupon U.S. Treasury bond, which I think holds a tremendous amount of value at current levels, and will likely benefit from the macroeconomic environment within which we find ourselves. I prefer individual bonds with maturity dates to lock in principal plus interest and a defined date of maturity. But for those who prefer ETFs the Vanguard Extended Duration Treasury ETF (NYSEARCA: EDV ) and the PIMCO 25+ Year Zero Coupon U.S. Treasury Index ETF (NYSEARCA: ZROZ ) are two options at the long end, and the PIMCO 1-3 Year U.S. Treasury Index ETF (NYSEARCA: TUZ ) and the PIMCO 3-7 Year U.S. Treasury Index ETF (NYSEARCA: FIVZ ) at the short end and belly of the curve respectively. Understand however, that owning ETFs instead of bonds with maturity dates, does expose investors to a greater amount of risk, and is not recommended for cash. Buying the U.S. Dollar A slightly more risky strategy is to buy the U.S. dollar in the currency market. If you are not a financial professional, there are several ETFs such as the PowerShares DB USD Bull ETF (NYSEARCA: UUP ) or the WisdomTree Bloomberg U.S. Dollar Bullish ETF (NYSEARCA: USDU ). Within the current economic environment, the U.S. seems to be the only country not trying to devalue their currency. Japan, as well as the entire Eurozone, and others continue to engage in policies that seek to devalue their currencies, thus making their goods cheaper. The currency wars are raging, and so is the U.S dollar’s value. In this environment, I expect the U.S dollar to continue its move upwards. Paying off Debt While not an overt place to stash your cash, paying off debt, especially within the context of investment leverage, will go a long way in ensuring investors meet their long term goals, and that they can survive hard times economically. As I stated above in a deflationary environment which I believe we are in globally, every dollar of debt strangles, while every dollar held gains value. The more dollars that can be averted from future debt payments allows the investor to take advantage of rock bottom prices in risk assets, as well as in the broader economy. Cash is king. Brokered CDs Brokered CDs are largely similar to the CDs you will find at your local bank. Many of them can be found through your broker, and offer yields as high as or higher than Treasury bonds in some cases. While I would not personally follow this course of action, it may be right for some investors, and deserves consideration. Conclusion In conclusion, the role of cash has largely been forgotten by many responsible for portfolio construction. I believe cash is an important asset class that is not to be ignored when times are good. In this piece we have explored some of the reasons to keep a steady allocation to cash, and where in the current economic environment to get a greater return on cash. In the end, if my assessment of the economic environment is correct, those with cash will be able to profit in a world of deflating prices. Disclosure: I am/we are long UUP, LONG TERM ZERO COUPON U.S. TREASURY BONDS. (More…) I wrote this article myself, and it expresses my own opinions. I am not receiving compensation for it (other than from Seeking Alpha). I have no business relationship with any company whose stock is mentioned in this article. Additional disclosure: This article is for informational purposes only and is not an offer to buy or sell any security. It is not intended to be financial or tax advice, and it is not financial or tax advice advice. Before acting on any information contained herein, be sure to consult your own financial or tax advisor.