Tag Archives: etf-hub

Does Diversifying Damage Performance?

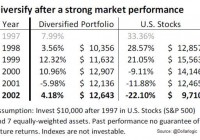
By Ronald Delegge During the 1849 California Gold Rush people sold all their possessions to chase gold. A small minority hit the jackpot, but most did not. Back then, the few people that did get wealthy by not diversifying were the hyper-extreme exception, not the rule. And it’s the same today. In retrospect, investors that overstuffed their portfolios on stocks like Amazon.com (NASDAQ: AMZN ), Netflix (NASDAQ: NFLX ), and other high-flyers have done well. Nonetheless, they’ve taken great financial risk that could’ve turned out to be catastrophic. The truth is that far more people have been damaged than helped by not diversifying their investment risk. History books are filled with people that lost everything by not diversifying. Of course, the history books are also filled with people that gained great wealth by not diversifying, but again, they are the hyper-extreme super rare exception – not the rule. And trying to join their ranks by risking everything you own is theoretically cute but drenched with hazard. Done Right An adequately diversified portfolio never concentrates market exposure to one or two asset classes, but rather spreads risk by maintaining exposure to the five core asset classes: stocks, bonds, real estate, commodities, and cash. Like a thermostat that remains on at all times, a core portfolio will always have exposure to these five major asset classes. Investors can dial up or dial down their exposure to each of these core asset classes based upon their investment goals, liquidity needs, and comfort level. Sadly, certain financial institutions and advisors – even so-called fiduciaries – operate under the false pretext they are “diversifying” client portfolios by overloading customers in “alternative investments” like illiquid securities and highly leveraged funds with juicy dividend yields. Furthermore, many of these same advisors habitually construct undiversified investment portfolios built entirely upon non-core assets like individual stocks, hedge funds, and other narrowly focused high risk securities. A Hedge for Ignorance? It’s been said that portfolio diversification is a hedge for ignorance. For anybody with this misinformed view, I’d like to familiarize you with Yale University’s endowment. Yale’s endowment returned 11% per annum over the 10 years ending June 30, 2014. Over that period, Yale’s return surpassed broad market results for U.S. stocks, which returned 8.4% annually along with U.S. bonds, which gained 4.9% annually. Even more impressive is how Yale’s endowment generated returns of 13.9% over the past two decades compared to the estimated 9.2% average return of college and university endowments. How did Yale do it? By diversifying investment risk across a variety of different assets like commodities, real estate, and stocks! Here’s the lesson: What worked for Yale can work for you. The table shown above, courtesy from our friends at Dollarlogic, further cements the point that diversification after a strong period of equity returns enhances rather than hurts a portfolio’s investment returns. Although a diversified portfolio underperformed the S&P 500 during the sizzling hot bull market from 1997 to 1999, a $10,000 diversified portfolio was worth more ($12,643) at the end of 2002 compared to just $9,710 for an all stock portfolio. In summary, portfolio diversification that is properly executed does not hinder but enhances risk-adjusted investment returns. Disclosure: No positions Link to the original post on ETFguide.com
Remember July 2011? The Stock Market’s Advance-Decline (A/D) Line Remembers

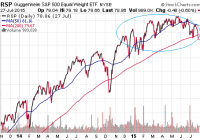
Paying a premium for growth is one thing. Chasing a handful of momentum stocks is another. Six corporations account for more than the entirety of the meager 2015 gains in the S&P 500. What happens when one examines the S&P 500 on an equal-weighted basis? Clearly, there is a dichotomy between the health of the overall stock market and the relatively high price of the popular benchmarks. According to Bloomberg data, the modest year-to-date increase in the S&P 500 is attributable to health care and retail alone. Worse yet, the two industry segments trade at a 20% premium to the market at large. Paying a premium for growth is one thing. Chasing a handful of momentum stocks is another. Brokerage firm Jones Trading sharpened the knife even further, noting that six corporations account for more than the entirety of the meager 2015 gains in the S&P 500. Those companies? Amazon (NASDAQ: AMZN ), Apple (NASDAQ: AAPL ), Facebook (NASDAQ: FB ), Gilead (NASDAQ: GILD ), Google (NASDAQ: GOOG ) and Walt Disney Co (NYSE: DIS ). The narrowing of the market itself coupled with the types of businesses on the list (with the possible exception of Walt Disney) strongly resembles late 1990s euphoria . What happens when one examines the S&P 500 on an equal-weighted basis? We find that that stocks have been stuck in one of the tightest trading ranges in market history for as long as the Federal Reserve ended quantitative easing (“QE3″). Here is the performance of the Guggenheim S&P Equal Weight ETF (NYSEARCA: RSP ) since QE3 wrapped up at the end of October in 2014. The ongoing deterioration in the S&P 500’s Bullish Percentage Index (BPI) underscores the challenges that investors face. Do they chase the Googles and the Gileads? Do they look for value in the energy patch through acquiring beaten down exchange-traded proxies like the Energy Select Sector SPDR ETF (NYSEARCA: XLE )? Or do they recognize that 50% of the S&P 500 components are currently in downtrends – a demarcation that is unfavorable for the long-term sustainability of the 3rd longest bull in history. Clearly, there is a dichotomy between the health of the overall stock market and the relatively high price of the popular benchmarks. Addressing the internal components of major benchmarks like the S&P 500, Dow Jones Industrials, NYSE Composite or NASDAQ as they relate to the handful of momentum leaders in those benchmarks leaves one to ponder what will happen next. Will the weight of the overall market crush the Atlas-like performance of health and retail? On the flip side, is it possible that underachieving sectors like industrials, materials, energy, utilities, transports and telecom might join the winner’s circle? Unfortunately, history suggests that overvalued sectors tend to crumble and join the beleaguered areas, as opposed to the troubled spots catching a bid first. Indeed, the last time that the New York Stock Exchange’s Advance Decline Line (A/D) Line fell below a 200-day moving average, the broader S&P 500 fell more than 19%. It occurred in July of 2011 as the euro-zone crisis had been spiraling out of control. For those that believe the illusion of economic acceleration could help the cause, media spin and double seasonally adjusted GDP reporting will not help. The reality of a lusterless U.S. economy is far too great. The manufacturing, mining, and utilities that collectively comprise the industrial sector recently registered its weakest year-over-year growth in a half-decade. Wholesale sales have dropped steadily over the past four years. Exporting on a strong dollar has been difficult for those multi-nationals that operate in Asia and Europe. Wage growth has been stuck in and around 2% since the end of the Great Recession in 2009. The workforce participation rate – a measure of actual employment – is as poor as it had been in the recession-weary late 70s. And homeownership at 63.4% is the lowest that it has been since 1967. What about the consumer? Aren’t people feeling wealthier? I suppose this depends upon the people you ask. The Conference Board’s U.S. Consumer Confidence was about as discouraging a data point as anyone has seen lately. Consumer expectations plummeted from 92.8 to 79.9 – the lowest reading since February 2014. And Gallup’s reading last week wasn’t much better; that is, for whatever reason, Americans believe the economy is getting worse. As long as the Federal Reserve maintains its plan to raise the cost of borrowing, and as long as the U.S. dollar rises alongside those expectations, the broader market is likely to remain range-bound. You’d have to hold the horses that have been winning, like the iShares S&P 100 ETF (NYSEARCA: OEF ) and the Health Care Select Sect SPDR ETF (NYSEARCA: XLV ). Yet you wouldn’t necessarily want to add to your overall equity position. You might also want to avoid areas of the market that are weakening in the face of higher borrowing costs and a higher greenback. The Industrial Select Sector SPDR ETF (NYSEARCA: XLI ) have gone nowhere in the nine months since QE3 officially ended. Click here for Gary’s latest podcast. Disclosure: Gary Gordon, MS, CFP is the president of Pacific Park Financial, Inc., a Registered Investment Adviser with the SEC. Gary Gordon, Pacific Park Financial, Inc, and/or its clients may hold positions in the ETFs, mutual funds, and/or any investment asset mentioned above. The commentary does not constitute individualized investment advice. The opinions offered herein are not personalized recommendations to buy, sell or hold securities. At times, issuers of exchange-traded products compensate Pacific Park Financial, Inc. or its subsidiaries for advertising at the ETF Expert web site. ETF Expert content is created independently of any advertising relationships.

4 ETFs Unexpectedly Rocked By China Turmoil

After stabilizing for three weeks, the Chinese stock market resumed its decline, with the Shanghai Composite Index tumbling nearly 8.5% in Monday’s trading session. This represents the biggest one-day drop in more than eight years. The index extended its losses, falling nearly 4% early in Tuesday session. The massive plunge came following the disappointing manufacturing numbers that reignited fresh concerns of a slowdown in the world’s second largest economy. This is especially true as the flash Caixin/Markit China Purchasing Managers’ Index (PMI) surprisingly dropped to a 15-month low of 48.2 in July from 49.2 in June. This is also the fifth month in a row when PMI is less than 50. The sharp selloff was not only confined to China but spread worldwide with rough trading in the Asian, European, and U.S. markets. Additionally, it added to the concerns for the emerging markets, which already fear a Fed rate hike later this year, leading to sliding currencies. Further, as China is the world’s largest consumer of raw materials, the slump in the economy has stressed key commodity prices like copper, oil and gold. In fact, the Thomson Reuters CRB commodities index fell to the lowest level in six years. While there have been losers in every corner, we have highlighted four ETFs that were unexpectedly crushed by the China turmoil in Monday session. Interestingly, none of these actually belong to China but are indirectly tied to it. Guggenheim Solar ETF (NYSEARCA: TAN ) This ETF targets the global solar industry by tracking the MAC Global Solar Energy Index. It holds 29 securities in its basket with the largest allocation going to the top firm – SunEdison (NYSE: SUNE ) – at 8.2% of total assets. Other firms hold less than 7% share. Chinese firms dominate the fund’s portfolio at nearly 46.7%, followed by the U.S. (37.4%) and Canada (5.4%). The product has amassed $302.9 million in its asset base and trades in solid volume of around 275,000 shares a day. It charges investors 70 bps in fees per year. The fund lost 2.5% on the day but is up 1.4% in the year-to-date time frame. Global X Central Asia & Mongolia Index ETF (NYSEARCA: AZIA ) This fund provides exposure to 21 stocks of Central Asia that derive revenues or are traded in Mongolia, Kazakhstan, Kyrgyzstan, Tajikistan, Turkmenistan or Uzbekistan. This is easily done by tracking the Solactive Central Asia & Mongolia Index. The product is highly concentrated on the top five firms at 40.4%, while energy and basic materials take the top two spots in terms of sector with roughly one-third share each. This is an unpopular and illiquid ETF in the emerging market space, with AUM of just $2.4 million and average daily volume of around 2,000 shares. Expense ratio came in at 0.69%. AZIA shed about 2.9% on the day and has lost 8.9% so far this year. Global X Copper Miners ETF (NYSEARCA: COPX ) This ETF targets the copper mining industry across the globe and follows the Solactive Global Copper Miners Index. Holding 23 stocks in its basket, it is highly concentrated on the top firm – Sandfire Resources ( OTC:SFRRF ) – at 8.7% while other firms hold no more than a 5.94% share. In terms of a national breakdown, Canada takes the top spot with 30% of assets, while Australia, Mexico and United Kingdom round out the next three spots with double-digit exposure. The product has managed $18.3 million in AUM while charges 65 bps in fees per year. It trades in light volume of 36,000 shares a day on average. The fund lost about 4.5% on the day and has piled up a huge loss of over 25% for the year so far. iPath Pure Beta Industrial Metals ETN (NYSEARCA: HEVY ) This note seeks to match the performance of the Barclays Commodity Index Industrial Metals Pure Beta Total Return Index, which is composed of five futures contracts on industrial metals. Four futures contracts (aluminum, nickel, copper and zinc) are traded on the London Metal Exchange and the other (copper) is traded on the COMEX division of the New York Mercantile Exchange. Unlike many commodity indexes, this product can roll into one of a number of futures contracts with varying expiration dates, as selected, using the Barclays Pure Beta Series 2 Methodology. The ETN manages just $0.5 million in asset base and sees paltry volume of about 300 shares a day, suggesting additional cost beyond the annual fee of 75 bps per year. The note lost 7.2% on the day, bringing the year-to-date loss to 12%. Original Post