Tag Archives: etf-hub

Stock Market Genius Made Easy: Spinoffs

Summary Empirical evidence would suggest spinoffs outperform the market. Prior research gives us a rough guide to investing in them. You can simplify the process with online tools and/or an ETF. More than 15 years ago, Joel Greenblatt wrote his masterpiece: You can be a stock market genius. Several other contributors here on Seeking Alpha have sung the book praises. I will be brief: If you haven’t read it, do so. (You could even read it for free by signing up for a free month at Scribd ) Among the strategies Greenblatt discusses, investing in spinoff stocks is one of them. A spinoff is when a company takes a division and separates it, creating a free standalone company. The strategy still works, however, the book was written 15 years ago. In this article, I will: Review briefly the papers proving empirical evidence that spinoff stocks tend to outperform. Rehash a few of Greenblatt’s pointers. Explore tools and strategies, which can simplify the process in 2015. The Empirical Evidence A while ago, John Mcconnell and Alexei Ovtchinnikov wrote a paper studying stocks of both parents and subsidiaries straight after a spinoff occurred between 1965 and 2000. They took the approach of buying the stocks straight after the spinoff and holding them for 36 months. They then computed excess returns in comparison with each stock’s industry, and with stocks with similar size. The results were impressive: The subsidiaries generated substantial ex-post alpha, especially within the first two years of holding the stocks. Source: Predictability Of Long Term Spinoff Returns Even after having adjusted the returns to a Fama-French-Carhart four-factor model, the sample still generated ex-post alpha. If you are interested in the nitty gritty details, I strongly suggest you read the paper. Here are a few points concerning the economic reasoning behind spinoff outperformance: Initial overselling of the security: Following a spinoff, the stock tends to be oversold as institutions which are unable to hold the stock for various reasons (They require dividend-paying stocks, they can’t invest in small caps, etc.) sell the stock. Many individual investors might also sell the spinoff because they want to be invested in the parent only. This depressed price creates an opportunity to find value. Better allocation of resources: Splitting a company into two entities allows each company to focus on creating value through their independent businesses. The destruction of the conglomerate discount: It is a well-known fact that the stock market tends to undervalue conglomerates because of the added complexity in analyzing them. Separating entities often creates pure play stocks in two different businesses. It can therefore be expected that this discount corrects within the first years after a spinoff. Or as Mr. Greenblatt says “Sometimes, Capitalism works” : In other words making the managers of each individual company more responsible, more accountable, and more directly incentivized, often plays out nicely. Greenblatt’s Strategy Throughout his career, Greenblatt has used this market inefficiency for personal gain. In his book, he recounts a few reasons why companies spinoff divisions, other than the obvious “to be better appreciated by the market”: To separate a “bad” business, so that the “good” one can show more of its value. Often they might leave the bad business with massive amounts of debt which can create a leveraged bet, for better or for worse. To create value for investors when a business can’t be sold as a whole, at least not at a reasonable price. To avoid being taxed on the sale of the business. Spinoffs are not taxed when the shares are distributed to the shareholders of the parent company. He also gives a rough hand guide to finding interesting spinoff opportunities: Read the WSJ looking out for upcoming spinoffs. (Don’t worry we’re in 2015 now, it needn’t be that hard, more on that later) Once you’ve found an upcoming spinoff, get your hands on the Form 10 also called general form for registration of securities, and look for some of these cues: Institutions don’t want the spinoff. Questions to ask are: Which current institutions hold the stock? What is their mandate? Are they going to be obliged to sell the spinoff? Insiders want it. Here the focus is on management incentives, including stock options. The idea behind these is that they make managers act like shareholders. There has been quite a debate concerning the effectiveness of such options but when combined with the right elements, they should work. Questions to ask are: Are managers going to be compensated with options? How far out of the money are these options? (Far enough is what you are looking for) Who is going to manage the company? How is management talking about the spinoff? (Watch out they may be talking it down to depress the price) Is what they are saying congruent with their various incentives? If not why not? Finally, usual fundamental analysis must be conducted . Questions to ask are: Is a great stock at a cheap price being uncovered? Has a leveraged bet with an interesting risk/return profile been created? Tools And Strategies in 2015 The economic reasoning for spinoff outperformance seems sound, and the empirical evidence of ex-post alpha is robust. If investors can generate alpha through investing in spinoffs what tools and strategies can they use today to simplify the process? Remember, how I mentioned you didn’t need to read the WSJ every day to find spinoff opportunities? As you might have guessed there is now a website on which you can find all upcoming spinoffs as well as all recent spinoffs . It’s a valuable tool which can be used to find interesting opportunities. Granted, you still need to do the hard work of looking up companies and picking your spots, but at least it is a lot easier. Source: Stockspinoffs.com As you can see, they even named it appropriately. I do want to disclose that I have no business with the website, and am only sharing because it’s an interesting tool. It is also useful to use it to see how spinoffs have performed over time. I will use this tool as a warning. NAME data by YCharts I picked three stocks randomly which spun off in August last year. As you can see these stocks aren’t a promise for riches, and investors should keep that in mind. You can’t just throw darts at a list to pick your spinoffs. You have to do the hard work. Or… you can invest in a quant spinoff ETF. Guggenheim Spin-Off ETF (NYSEARCA: CSD ) The Guggenheim Spin-off ETF seeks to reproduce the returns of the Beacon Spinoff Index before fees which will set you back 0.66% a year. The fund is constructed very similarly with weights changing only modestly. Here is a peak at CSD’s top 20 holdings vs. the index. These account for over 75% of the portfolio in both cases. Source: Guggenheim Investments What is interesting is how this index is constructed. Potential Index constituents include all equities trading on major U.S. exchanges of companies that were spun-off during the two year period beginning 30 months prior to reconstitution and ending 6 months prior to reconstitution. This time frame may be extended to compensate for periods where there are too few new spinoffs to populate the index. The Spin-off Index is comprised of up to of the 40 highest-ranking stocks chosen from the universe of spun-off companies. Each company is ranked using a 100% quantitative rules-based methodology that includes composite scoring of several growth-oriented, multi-factor filters, and is sorted from highest to lowest. Up to 40 stocks are chosen and given a modified market cap weighting with a maximum weight of 4.5%. The constituent selection process and portfolio rebalance is repeated semi-annually, however, if there are not enough new Spin-offs to populate the index, a rebalance may be delayed. What this means is that you will own stocks at the earliest 6 months after they have spun off, and they will be removed at most 36 months after the spinoff (Selection process happens semiannually, and stocks can be included if spun off up to 30 months prior to constituent selection). I have not found any information about their so called rule based ranking. Whether this ranking generates value or not might be questionable, but it can’t be worse than simply ranking stocks by market cap, can it? The index gives each of its 40 stocks a maximum weight of 4.5% whereas CSD weights stocks as high as 5%. So here you go, a no hassle, sleep well at night way to get exposure to spinoffs and their inherent inefficiencies through the first years. How has it performed? This year just as bad as the overall market, over time, a lot better. CSD data by YCharts CSD data by YCharts I will be allocating money towards the CSD ETF as soon as the next transfer makes it to my trading account. Conclusion Spinoffs have beaten the market. Empirical evidence proves it. Sound economic reasoning would suggest they might continue to do so. Great results can be attained by picking your spots. You’ll probably do okay with passive exposure. Disclosure: I/we have no positions in any stocks mentioned, but may initiate a long position in CSD over the next 72 hours. (More…) I wrote this article myself, and it expresses my own opinions. I am not receiving compensation for it (other than from Seeking Alpha). I have no business relationship with any company whose stock is mentioned in this article.
The Oil Crash: 3 ETFs For Targeted Investment In The Energy Sector

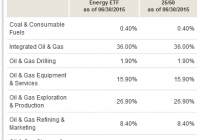
Summary My breakfast reading this morning was an article from a fellow Seeking Alpha author suggesting that bargains could be found in the energy sector. While disagreeing with nothing in his article, I wondered what I could offer an investor who might be interested in using ETFs for a diversified investment in the sector. I came up with three solid candidates. This article will provide a brief overview. As a Seeking Alpha author myself, as time allows I enjoy reading as many articles as I can from fellow authors. My breakfast reading this morning included this article from fellow Seeking Alpha author Regarded Solutions . I think it is a great article, and well worth taking the time to read it for yourself. Essentially, though, the premise was as follows: The energy sector has been killed recently, due to the low price of oil. However, unless one believes in the imminent demise of oil and all its uses, now may be a good time to at least look at scaling into bargains. In particular, the author recommends taking a hard look at Exxon Mobil (NYSE: XOM ). Before I go any further, let me be explicit that it is not the purpose of my article to either dispute any of the points in his article nor to diminish anyone’s interest in purchasing shares in Exxon Mobil. However, I am ETF Monkey, after all. “What,” I thought, “might I suggest to the person who liked the concept, but wished to employ the power of ETFs to diversify their risk, as well as possibly invest in small, incremental chunks?” My research led to three quality candidates: Vanguard Energy ETF (NYSEARCA: VDE ) Energy Select Sector SPDR Fund (NYSEARCA: XLE ) iShares U.S. Energy ETF (NYSEARCA: IYE ) Let’s take a quick look at each ETF, and then I will offer a couple of concluding comments at the end. Vanguard Energy ETF Let’s start with some relevant data from the current factsheet . VDE has an inception date of 9/23/04, so has been around for almost 11 years. It tracks the MCSI USA Energy IMI 25/50 Index . As of 6/30/15, the fund contains 151 stocks, compared to 149 in the index. It has $5.0 billion in Assets Under Management (AUM). In classic Vanguard fashion, it carries a very low .12% expense ratio and has an average spread of .03%, very good performance for a sector-specific ETF. Finally, it carries a 30-day SEC yield as of 7/27/15 of 2.76%. Here is a look at the sector breakdown: Next, let’s have a look at the Top 10 holdings, after which I will offer a couple of comments. (click to enlarge) I’d just like to draw your attention to a couple of things: You may have noted that Exxon Mobil is the fund’s top holding, at 21.3%. In other words, for every $1,000 you invest, you are essentially investing $213 in Exxon Mobil. Even though there are 151 stocks in the portfolio, the Top 10 comprises 62.1% of total net assets. This is a much higher concentration than a broader market index ETF, such as the Vanguard Total Stock Market ETF (NYSEARCA: VTI ), for which the Top 10 holdings only comprise 14.4% of total net assets. However, in this context, this is a good thing. You are still making a very targeted investment in a sector, while still retaining a measure of defense against single-entity risk . Within the sector, the major portion of your funds are in developed, established companies. Energy Select Sector SPDR Fund Again, let’s start with relevant data from the latest factsheet . XLE, from State Street Global Advisors (NYSE: STT ), one of the oldest providers of ETFs, has an inception date of 12/16/1998. It tracks the S&P Energy Select Sector Index . As of 6/30/15, the fund contains 42 stocks, compared to 40 in the index. It has $11.6 billion in AUM. The fund carries a very competitive .15% expense ratio and has an average spread of .01%, which is truly exemplary for a sector-specific ETF. Finally, it carries a 30-day SEC yield as of 7/27/15 of 2.89%. Here are the fund’s Top-10 holdings: A couple of notes: Despite the far smaller number of stocks in XLE vs. VDE (40 vs. 151), the Top 10 concentration is virtually the same; 61.64% for XLE vs. 62.10% for VDE. At the same time, Exxon Mobil’s weighting is “only” 16.38% here vs. 21.30% in VDE. Therefore, your decision between the two may at some level hinge on how much concentration you wish to have in Exxon. iShares U.S. Energy ETF As always, some relevant data from the latest factsheet . IYE, from BlackRock, Inc. (NYSE: BLK ), has an inception date of 6/12/00. It tracks the Dow Jones U.S. Oil & Gas Index . As of 6/30/15, the fund contains 92 stocks, compared to 93 in the index. It is the smallest of the three ETFs, with $1.27 billion in AUM. The fund has an average spread of .03%, and carries a 30-day SEC yield as of 6/30/15 of 2.50%. Unfortunately, IYE also carries an expense ratio of .45%, meaning that the fund would need to outperform our two competitors by some .3% per year to overcome the handicap from expenses. Here are the fund’s Top-10 holdings: My thoughts: IYE is in the middle of the pack in terms of diversification, with 92 holdings. It’s Top 10 concentration is the greatest of the three ETFs, at 63.69%. Its weighing in Exxon Mobil is also the highest of the three; at 22.57% vs. VDE’s 21.30% and XLE’s 16.38%. Again, this may factor into your decision if you desire a heavier weighting in Exxon. Comparative YTD Performance As featured in the article that inspired this offering, the energy sector has been hit hard recently. That being the case, how have our three ETFs performed? Have a look: VDE data by YCharts As you can see, VDE and XLE are in a virtual dead heat, with only .1% separating them. It becomes basically a tie when you factor in XLE’s slightly higher 2.89% vs. 2.76% SEC yield. Summary and Conclusion Based on my examination, I am going to call it a tie between VDE and XLE. Both have long track records. Both have impressive amounts of AUM. And both have very competitive expense ratios which, all other things being equal, ultimately puts money in your pocket. As always, though, I will include the caveat that the question of which ETF you can trade commission-free may factor into your ultimate decision, particularly if you wish to make multiple small, incremental investments. My thanks to Regarded Solutions for a wonderful inspiration, and to all of you for reading. Happy investing! Disclosure: I/we have no positions in any stocks mentioned, and no plans to initiate any positions within the next 72 hours. (More…) I wrote this article myself, and it expresses my own opinions. I am not receiving compensation for it (other than from Seeking Alpha). I have no business relationship with any company whose stock is mentioned in this article. Additional disclosure: I am not a registered investment advisor or broker/dealer. Readers are advised that the material contained herein should be used solely for informational purposes, and to consult with their personal tax or financial advisors as to its applicability to their circumstances. Investing involves risk, including the loss of principal.

Pick A Valid Strategy, Stick With It

I’m not going to argue for any particular strategy here. My main point is this: every valid strategy is going to have some periods of underperformance. Don’t give up on your strategy because of that; you are likely to give up near the point of maximum pain, and miss the great returns in the bull phase of the strategy. Here are three simple bits of advice that I hand out to average people regarding asset allocation: Figure out what the maximum loss is that you are willing to take in a year, and then size your allocation to risky assets such that the likelihood of exceeding that loss level is remote. If you have any doubts on bit of advice #1, reduce the amount of risky assets a bit more. You’d be surprised how little you give up in performance from doing so. The loss from not allocating to risky assets that return better on average is partly mitigated by a bigger payoff from rebalancing from risky assets to safe, and back again. Use additional money slated for investing to rebalance the portfolio. Feed your losers. The first rule is most important, because the most important thing here is avoiding panic, leading to selling risky assets when prices are depressed. That is the number one cause of underperformance for average investors. The second rule is important, because it is better to earn less and be able to avoid panic than to risk losing your nerve. Rule three just makes it easier to maintain your portfolio; it may not be applicable if you follow a momentum strategy. Now, about momentum strategies – if you’re going to pursue strategies where you are always buying the assets that are presently behaving strong, well, keep doing it. Don’t give up during the periods where it doesn’t seem to work, or when it occasionally blows up. The best time for any strategy typically come after a lot of marginal players give up because losses exceed their pain point. That brings me back to rule #1 above – even for a momentum strategy, maybe it would be nice to have some safe assets on the side to turn down the total level of risk. It would also give you some money to toss into the strategy after the bad times. If you want to try a new strategy, consider doing it when your present strategy has been doing well for a while, and you see new players entering the strategy who think it is magic. No strategy is magic; none work all the time. But if you “harvest” your strategy when it is mature, that would be the time to do it. It would be similar to a bond manager reducing exposure to risky bonds when the additional yield over safe bonds is thin, and waiting for a better opportunity to take risk. But if you do things like that, be disciplined in how you do it. I’ve seen people violate their strategies, and reinvest in the hot asset when the bull phase lasts too long, just in time for the cycle to turn. Greed got the better of them. Markets are perverse. They deliver surprises to all, and you can be prepared to react to volatility by having some safe assets to tone things down, or, you can roll with the volatility fully invested and hopefully not panic. When too many unprepared people are fully invested in risky assets, there’s a nasty tendency for the market to have a significant decline. Similarly, when people swear off investing in risky assets, markets tend to perform really well. It all looks like a conspiracy, and so you get a variety of wags in comment streams alleging that the markets are rigged. The markets aren’t rigged. If you are a soldier heading off for war, you have to mentally prepare for it. The same applies to investors, because investing isn’t perfectly easy, but a lot of players say that it is easy. We can make investing easier by restricting the choices that you have to make to a few key ones. Index funds. Allocation funds that use index funds that give people a single fund to buy that are continually rebalanced. But you would still have to exercise discipline to avoid fear and greed – and thus my three example rules above. If you need more confirmation on this, re-read my articles on dollar-weighted returns versus time-weighted returns . Most trading that average people do loses money versus buying and holding. As a result, the best thing to do with any strategy is to structure it so that you never take actions out of a sense of regret for past performance. That’s easy to say, but hard to do. I’m subject to the same difficulties that everyone else is, but I worked to create rules to limit my behavior during times of investment pain. Your personality, your strategy may differ from mine, but the successful meta-strategy is that you should be disciplined in your investing, and not give into greed or panic. Pursue that, whether you invest like me or not. Disclosure: None