Tag Archives: etf-hub

Enhance Your Utility Sector Returns

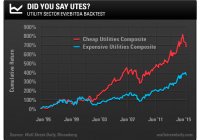
By Alan Gula Imagine you’re a pilot who is preparing to land an airplane. You’ve just eased up on the throttle, thereby slowing your airspeed. To compensate, you gently pull back on the yoke to increase the plane’s angle of attack. A buzzer suddenly goes off… it’s the stall warning. Your approach is too slow! The aircraft is at risk of rapidly losing altitude and the consequences could be dire. The concept of a stall speed can apply to economics, as well. That is, economic output tends to transition to a slow-growth phase (stall) at the end of an expansion before the economy falls into a recession. Right now, a buzzer should be sounding at the Federal Reserve because the U.S. economy has officially slowed below stall speed. Excluding the impact of inventories, real economic growth in the first half of 2015 was just 0.54%. Lackluster wage growth also indicates continued labor market slack. In the second quarter, the Employment Cost Index, a broad measure of labor costs, posted the smallest gain since records began in 1982. Indeed, recent data further support my view that the risk of a meaningful rise in interest rates is low. And because we’re in a subdued economic growth and inflation environment, I believe that the utilities – electricity, gas, and water companies – continue to be viable investments. However, we must be wary of valuations, especially for relatively high-yielding securities. Investors starved for yield have bid up prices across the utility sector, pushing average valuations to historically high levels. We also want to avoid utilities that are excessively levered. Luckily, we can help alleviate both of these concerns with the trusty enterprise value-to-EBITDA (EV/EBITDA) ratio. Remember, the EV/EBITDA ratio compares the total stakeholder value net of cash with the total cash flows available to all stakeholders. Firms with high equity valuations and/or high debt levels have higher (less attractive) EV/EBITDA ratios. To illustrate the power of this valuation metric, I ran a backtest starting in June 1995. Here, my universe of stocks is U.S.-listed utilities with market caps above $1 billion. The stocks are ranked based on EV/EBITDA, and the top two deciles (cheapest 20%) are included in the Cheap Utilities Composite. The bottom two deciles (most expensive 20%) are included in the Expensive Utilities Composite. The screen is rerun each month and the composites change as the companies’ valuations change. The constituents are allocated to on an equal-weight basis and the cumulative total return (dividends reinvested) for each composite is tallied. The results of this backtest are shown below: As you can see, the Expensive Utilities Composite produces a cumulative return of 363% over 20 years. Meanwhile, the Cheap Utilities Composite gained an incredible 680%, which actually trounces the 451% total return posted by the mighty S&P 500 over this same time frame. Clearly, there’s an edge to buying cheap utilities based on the EV/EBITDA ratio. Furthermore, the cheap utilities also experienced smaller declines. The largest drawdown (peak to trough decline) that you would’ve experienced in the Expensive Utilities Composite was 40%, compared with just 35% for the Cheap Utilities Composite. Higher returns with lower volatility – the best of both worlds. Currently, the median EV/EBITDA for all U.S.-listed utilities with market caps greater than $1 billion is 9.9, which is relatively high. The current constituents of the Cheap Utilities Composite, which includes companies such as AES (NYSE: AES ), Ameren (NYSE: AEE ), AGL Resources (NYSE: GAS ), and Pinnacle West (NYSE: PNW ), have a median EV/EBITDA of 7.8. To make sure that the utilities you own are trading at reasonable valuations, the Key Statistics page on Yahoo! Finance has EV/EBITDA along with a host of other data. In the midst of persistently low interest rates and with an economy below stall speed, utilities are attractive investments that can help protect your portfolio from broader stock market declines. Just make sure your utilities are cheap with a low degree of leverage. Original Post
Pioneer Municipal High Income Looks Attractive Here

Summary High tax exempt yield of nearly 7%. Very low leverage cost using auction rate preferreds. 7% discount to NAV for a fund that often trades at a premium. It looks like the Federal Reserve is getting ready to raise the short-term Fed Funds rates before the end of this year. Currently the Fed keeps the target rate in a range from zero to 25 basis points, or an average of 0.125%. Most likely the initial rate increase will be quite modest. There are several ways the Fed can increase the rate. Some possible options are: – Eliminate the range concept and set the new target interest rate at 0.25%. (average increase of 0.125%) -Bump up the range slightly to 0.125%-0.375%. (average increase of 0.125%) -Bump up in the range by 25 basis points to 0.25%-0.50%. I don’t think any of these rate increase options would surprise the market, and it is quite likely that the more important longer-term rates (like the 10-year Treasury rate) have already discounted any Fed rate increase. It wouldn’t surprise me to see a drop in longer-term rates once the uncertainty about the first Fed rate hike has passed. The 10-year yield in the US is now about 40 basis points higher than the 10-year yields in Spain and Italy, so there is plenty of room for a drop here. In years since 2008, there have been major changes in the financing of muni bond CEFs. The CEF auction rate preferred (e.g., ARP) market basically froze up in early 2008. There has been no new ARP financing since then. There was about $60 in billion in ARP financing outstanding in 2008, but most of this has been redeemed since then. A number of new leveraging options to replace ARP financing have been developed for muni bond CEFs, but these newer financing tools are currently more expensive than ARP financing by 50 basis points or more. The muni CEFs that have replaced ARP financing with these newer forms of leverage have lower earnings than before, which leads to lower sustainable dividends. Funds that have kept their ARP financing deserve to sell at a premium, or at least a lower discount to NAV. The Pioneer Municipal High Income Fund (NYSE: MHI ) is a leveraged national municipal bond fund. It seeks high current income exempt from regular Federal income tax with capital appreciation through investment in investment grade US tax exempt municipal securities. I have discussed various factors below, which I use to evaluate municipal bond closed-end funds. Note: Data below is sourced from the Pioneer Investments web site unless otherwise stated. Factor #1: What is the distribution rate? MHI currently has a high distribution yield of 6.91%. It pays a regular monthly dividend of $0.07 per share or an annual distribution of $0.84. Factor #2: What is the likelihood the fund can raise its monthly dividend? To determine this, I look at the Average Earnings/Current Dividend Ratio. This ratio tells you whether or not a fund is earning its current dividend. If the value is well above 100%, it means the fund can easily afford to raise its distribution rate. For MHI, the average earnings for April, 2015 was $0.0712, so the latest Average Earnings/Current Dividend ratio = 101.7%. This factor is a slight positive, since MHI over-earned its last distribution. There is a large positive value for “Undistributed Net Investment Income” or UNII Balance of +0.1622, which means that MHI has over two months of interest in reserve, which can cover future monthly shortfalls that may develop for quite some time. Factor #3: What is the Expense Ratio? I look at the Baseline expense ratio, which does not include leverage costs. MHI has a baseline expense ratio of 1.03%, which is reasonable for a fund with attractive low cost leverage. Factor #4: What is the discount to NAV? MHI is currently selling at a -7.46% discount to NAV. The 6-month average premium is 1.75%. The one year Z statistic is -1.94. So on a one-year basis, the discount is nearly two standard deviations below average. Overall, this factor is a big positive for MHI. Source: cefanalyzer Factor #5: How much leverage is used, and what is the borrowing cost? In the last annual report, the fund reported that 25% of the total managed assets were financed by leverage obtained through ARP financing. The maximum rate for each series is 125% of the 7 day commercial paper rate or adjusted Kenny rate. Dividend rates on APS ranged from 0.088% to 0.261% during the year ended April 30, 2015. This leverage is highly favorable and is a major positive factor for MHI. Factor #6: What is the AMT exposure? The fund did not provide recent AMT data, but up to 25% of the fund may be invested in securities subject to AMT. For this reason, this fund may not be ideal for investors with heavy AMT exposure. Factor #7: What is the credit quality? This is the S&P ratings quality breakdown for MHI as of 6/30/2015: AAA 6.82% AA 21.22% A 5.85% BBB 18.88% BB 8.51% B 8.32% CCC 2.35% Not Rated 26.52% MHI has medium to high credit risk with an average credit rating around BB+. Factor #8: What is the interest rate exposure? MHI has a weighted average life of 7.85 years and a duration of 9.17 years (leverage adjusted = 12.28). This is a little above average. I prefer funds with an average adjusted duration of 10.0 or less. Factor #9: What is the call exposure? Here is a table with the call exposure as of June 30, 2015: Under 5 years 48.8% 5-9.99 years 30.7% Over 10 years 1.0% Other 4.2%% Non-Callable 15.3% MHI has moderate call risk over the next few years if interest rates fall. For most investors, this is not a major concern, since they are worried more about higher interest rates than lower interest rates. Morningstar computes the average coupon rate of its bonds at 6% with an average price of 106. Given the high level of the UNII balance, there is only limited short-term risk to the monthly dividend even if interest rates fall more than expected. Factor #10: For a national fund, what is the breakdown by state? Top 5 States Texas 11.59% Illinois 11.40% New York 8.08% California 6.61% Washington 6.01% There is currently no exposure to Puerto Rico. Source: Morningstar Factor #11: How good is the trading liquidity? MHI has an average daily volume of 102,000 shares, and an average dollar volume of $1.25 million. Factor #12: What percent of the portfolio is in Housing-Multifamily bonds? I like to avoid funds where the Housing Multi-Family sector is above 10%. MHI has no exposure to housing bonds. Factor #13: Fund Management MHI is managed by David J. Eurkus and Jonathan Chirunga. Mr. Eurkus has more than 40 years of investment experience and has been the portfolio manager of the fund since inception. Mr. Chirunga joined Pioneer in 2011 and has been an investment professional since 1996. Based on the above 13 factors, I am currently quite positive on MHI. It is an attractive fund because of its high relative discount to NAV, very low leverage costs and reasonable expense ratio. Disclosure: I am/we are long MHI. (More…) I wrote this article myself, and it expresses my own opinions. I am not receiving compensation for it (other than from Seeking Alpha). I have no business relationship with any company whose stock is mentioned in this article.

REIT CEFs: What Should You Be Looking At Now?

REIT stocks have taken a hit of late. That’s left REIT CEFs suffering, too. Is now the time to buy in and what kind of REIT CEF’s look best? I decided to look at two intertwined questions based on reader comments to an article I wrote about RMR Real Estate Income Fund (NYSEMKT: RIF ): First, is the REIT sell off over? And Second, what are the best priced REIT CEFs right now? No rush To start with, I don’t think REIT stocks are cheap right now. They are certainly cheaper than they were earlier in the year, but that doesn’t make them a good value. I outlined my concerns in a recent article, which you should read for more depth. But I’ll summarize: Demand for REITs, and other income oriented investments, has been driven by the historically low interest rate environment engineered by the Federal Reserve. That can’t last forever and with the Fed talking about a rate increase, the recent sell off is a sign that investors are getting spooked. And that’s what makes me believe there’s a good possibility for more downside from here. Investor sentiment is what drives market prices over the near term. But investor sentiment moves like a pendulum, going from extreme to extreme. Sure we’ve pulled away from REITs being overvalued and loved by all. But my guess is that we’re just passing through something that approximates fair value right now on our way to the other side, where REITs will be out of favor. That, however, is just my opinion. Brad Thomas, who writes the Intelligent REIT Investor for Forbes, for example, counters that, suggesting that now is a good time to be looking at REITs. That said, he isn’t calling for investors to back up the truck and load up. He suggests what he calls a “patient hand.” Or, more specifically, dollar cost averaging so you don’t put all your capital at risk. In the end, however, Brad and I both agree that REITs can be a great benefit to a portfolio, providing income and diversification. And, frankly, I’m the first to admit that if you need income now, sitting on the sidelines isn’t a workable investment strategy. So, you may, indeed, be in the market now for REITs right now. Clearly sticking with industry leaders is a good call. But outsourcing to a dedicated REIT manager is also an interesting option. And that’s where I’ve seen some readers asking about closed-end funds. What REIT CEFs are good? You could, of course, purchase an open-end fund to get your exposure to REITs. But that means you’ll be paying market price, since open-end funds have to trade at net asset value, or NAV, at all times. Exchange traded funds also tend to trade at or very close to NAV and are often just index offerings. Closed-end funds, on the other hand, are actively managed and frequently trade at a discount to their NAVs. And that’s driven by investor sentiment. When investors are pessimistic, discounts widen. And they are extra wide at a number of REIT CEFs right now. That will boost yields and potentially provides some downside protection (a margin of safety, if you will) if REIT prices fall further-After all, you paid a below market price. But all CEFs aren’t the same and you need to know what you are buying. For example, RIF, which I wrote about recently , is trading with a very large 20% discount to NAV. Its three-year average is around 14.5%. The CEF owns a portfolio of REITs and REIT preferred stocks, almost like a balanced fund, in a way, and sports a yield of around 6.9%. But, you’ll want to keep a few things in mind. First, RIF uses leverage. Leverage stood at about 30% of assets as recently as the end of March. Leverage is great in up markets because it enhances return, but can be damaging in down markets because it exacerbates losses. If you are looking at a REIT CEF, take leverage into consideration. Second, RMR is the fund’s manager. Although this company runs a few public REITs, you may or may not be comfortable with their managing history. That’s where a fund like Cohen & Steers REIT and Preferred Income Fund (NYSE: RNP ) might come in. Like RIF, RNP mixes REITs with REIT preferred stocks and uses leverage (around 25% of assets). Also like RIF, RNP is trading at a wider discount than usual: RNP’s discount is around 17% compared to its three-year average of nearly 11%. However, Cohen & Steers was one of the first asset managers to specialize in REITs and is highly respected in the industry. If you are concerned about RMR but like the idea of RIF, Cohen & Steer’s RNP would be a good alternative. RNP’s distribution yield of 8.3% also offers more income to investors. That said, there’s a reason why these two funds have among the widest discounts in the REIT CEF space: Preferred stocks are likely to take a hit if rates go higher because they are similar in many ways to a bond. Add in leverage and you can see that these CEFs might be riskier then they first appear. And why investors are asking for such notable discounts relative to other REIT CEFs. And that’s why you might prefer a fund like Cohen & Steers Total Return Realty Shares (NYSE: RFI ), which yields around 7.6%, in between the two above REIT CEFs. RFI invests only in REIT stocks and doesn’t use any leverage. That said, its discount is only about 9%. So you aren’t getting as good a deal on an absolute basis. But what about on a relative basis? Total Return Realty Shares’ average discount over the past three years is around 3%, so it’s actually trading much further below its historical range than either RIF or RNP. So, relatively speaking, RFI could be the better deal and it has a lower risk profile. Not the only options This trio of funds obviously aren’t the only RIET CEF options. But they show pretty clearly some of the things you’ll want to look at beyond a steep absolute discount, including management, portfolio structure, use of leverage, and relative discount. I personally like Cohen & Steers as a company and right now I’d suggest pulling back on risk for most investors. Thus, I think starting your research with an unleveraged pure play like RFI is a good idea if you are looking to outsource your REIT exposure. You might decide you are willing to take on more risk, and that’s fine. Just make sure you understand that risk, and the alternatives you have, before you take it. Disclosure: I/we have no positions in any stocks mentioned, and no plans to initiate any positions within the next 72 hours. (More…) I wrote this article myself, and it expresses my own opinions. I am not receiving compensation for it (other than from Seeking Alpha). I have no business relationship with any company whose stock is mentioned in this article.