Tag Archives: etf-hub

Water: Investing In The Future

Summary Water is a scarce commodity. Water scarcity already affects every continent. Around 1.2 billion people, or almost one-fifth of the world’s population, live in areas of physical scarcity. Water Resource Portfolio ETF offers an excellent opportunity to invest in the water industry. Even though water is something which seems normal for the average Joe in a developed country, it is definitely not as normal as it seems . Water is a scarce commodity and an absolute necessity for every living creature on the planet. The United Nations indicate that roughly 1.2 billion people (around 1/5th of the world’s population) live in the areas where there is no physical abundance of water. India for example is faced with the prospect of becoming water scarce by 2025 where demand of water will exceed all the current sources of supply of water. India might seem far away, but closer to home such as in California water scarcity is becoming a serious problem. Businesses will have to treat this precious resource far more carefully in the future. Source : Getty Images (a footbridge spans a completely dry river bed in Porterville, California) One way of investing in water is to invest in the PowerShares Water Resources Portfolio ETF (NYSEARCA: PHO ) , one of the largest water ETFs in the world. This article will cover the fundamental analysis of Water Resource Portfolio. Water ETF: Main holdings Source : etfdb.com The issuer of this ETF is Invesco, a large independent investment management company incorporated in Bermuda. The expense ratio of 0.61% is a reasonable number and not incredible expensive. With 800 million assets under management it’s not a large ETF. They are currently trading 10% under its year high and 3% above its year low. ETF: Main Holdings Source : Invesco The 3 largest holdings are Ecolab (NYSE: ECL ), Pentair (NYSE: PNR ) and First Solar Inc (NASDAQ: FSLR ) which in total hold more than 1/4th of the assets. Ecolab is an American provider of hygiene, energy technologies and water. It’s a firm of considerable size with over 45.000 employees. Ecolab is currently priced only $3 underneath its 52 week high , they recently announced earnings which was roughly in line with expectations. Revenue was $3.4B, a miss of $70M. Pentair is an industrial company headquartered in Manchester delivering a variety of water, fluid and technical solutions. The firm is a bit smaller in contrast to Ecolab with revenue of around $7 billion. First Solar is an American Photovoltaic manufacturer of solar panels and supporting services which include end-of-life panel recycling. First Solar is currently trading at P/E of around 20, almost $30 dollars below its 52wk high. It has been beaten quite significantly lately. Nevertheless, corporate earnings will be announced on the 4th of August and based on a recent well informed article published on Seeking Alpha by Nir Nabar, I’m expecting a rebound. ETF: Fund Characteristics Source: Invesco It’s important to realize that the ETF does not come at a massive discount. At a P/E of over 30, it is not cheap. Yet the share price has sharply dropped over the last few weeks presenting itself as a buy. Source : Ycharts Conclusion Water is an incredibly important commodity. As it’s scarce, business can’t do without proper water management. In today’s society there are plenty of solid water management firms. This ETF provides an excellent opportunity to invest in the business flow of water related businesses: from management, production to filtering of water, this ETF has a solid mixture between small and large cap related firms. With one of its largest holdings close to a 52wk low and it will publish earnings soon, I’m expecting a rebound in this ETF. Water remains an investment in the future. PHO is a buy. Disclosure: I am/we are long PHO. (More…) I wrote this article myself, and it expresses my own opinions. I am not receiving compensation for it (other than from Seeking Alpha). I have no business relationship with any company whose stock is mentioned in this article.

A Pleasant Surprise Among Emerging Market ETFs

Broadly speaking, these are not the best of times for emerging market exchange traded funds. India large-cap ETFs have been significantly better or less bad than other single-country and diversified emerging markets ETFs over the past month. In the near term, India ETFs could pullback following the Reserve Bank of India’s decision Tuesday to hold interest rates at 7.25 percent. By Todd Shriber, ETF Professor Broadly speaking, these are not the best of times for emerging market exchange traded funds. Things are so bad that 22 emerging markets funds hit 52-week lows on Monday. Since the star of the current quarter, the iShares MSCI Emerging Markets ETF (NYSEARCA: EEM ) has bled nearly $2.5 billion in assets. However, there is some light among the darkness and it comes courtesy of Indian small-caps. India large-cap ETFs have been significantly better or less bad than other single-country and diversified emerging markets ETFs over the past month, but funds such as the Market Vectors India Small-Cap Index ETF (NYSEARCA: SCIF ) , the EGShares India Small Cap ETF (NYSEARCA: SCIN ) and the iShares MSCI India Small Cap Index ETF (BATS: SMIN ) have legitimately impressed . While the MSCI Emerging Markets Index has tumbled 5.6 percent over the past month, the aforementioned trio of India small-cap ETFs posted an average return of almost 5.5 percent. This is not unfamiliar territory for India ETFs, which were the shining stars of the BRIC quartet last when emerging markets equities slumped. In the near term, India ETFs could pullback following the Reserve Bank of India’s decision Tuesday to hold interest rates at 7.25 percent, but the central bank has obliged with three rate cuts earlier this year, at least two of which can be considered surprises. Interestingly, the gains for Indian small-caps over the past month arrived as investors pulled $35 million from Indian stocks last month, still a scant percentage of the $7.1. billion that has flowed into stocks in Asia’s third-largest economy this year, according to Bloomberg . Divergent Returns Significant differences between the India small-cap ETFs tell the story of divergent returns. For example, the Market Vectors India Small-Cap Index ETF features a 21.2 percent to consumer discretionary stocks, leveraging the ETF to India’s burgeoning consumer story. SMIN, the iShares offering, is also a play on India’s resurgent domestic economy with a 44.3 percent allocation to financial services and industrial names. The EGShares India Small Cap ETF devotes over half its weight to financial stocks and industrials. A BlackRock fund manager recently sounded a bullish tone on Indian non-bank financials and select sub-sectors of the industrial space. Though the fund manager did not mention the ETFs highlighted here, institutional support for Indian small-caps should drive the likes of SCIF, SCIN and SMIN higher. Indian small-caps are not a bump-free ride. For example, SCIF has a three-year standard deviation of almost 32 percent, or 2 1/2 times that of the MSCI Emerging Markets Index. However, Indian small-cap, at least as measured by SCIF and SCIN, are not excessively valued. SCIF sports a price-to-earnings ratio of just 11 , while SCIN’s price-to-book ratio is just 1.16. Disclaimer: Neither Benzinga nor its staff recommend that you buy, sell, or hold any security. We do not offer investment advice, personalized or otherwise. Benzinga recommends that you conduct your own due diligence and consult a certified financial professional for personalized advice about your financial situation. Disclosure: I/we have no positions in any stocks mentioned, and no plans to initiate any positions within the next 72 hours. (More…) I wrote this article myself, and it expresses my own opinions. I am not receiving compensation for it. I have no business relationship with any company whose stock is mentioned in this article.

Does X Mark The Spot?

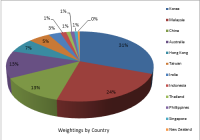
Heavily weighted towards cyclically sensitive sectors. The fund has holdings in top Asia-Pacific companies, excluding Japan. The exclusion of the Japanese economy doesn’t seem to serve any purpose. From its recovery after an ill-conceived, devastating global conflict, Japan underwent a complete restructuring under the leadership of Prime Minister Hayato Ikeda in the 1950s. The constitution was rewritten and modernized, heavy industry and infrastructure was reconstructed, bank regulations were eased and protectionist policies were instituted in order to focus on rebuilding the economy, organically. By the 1960s, referred to by economist as Japan’s ‘golden 60s’, the economy took off and continue to expand, from about $91 billion in 1965 to well over an astonishing $1 trillion by 1985. However, as often happens when left unchecked, growth became unsustainable leading to an asset bubble, which collapsed in 1989. For the next 25 years the economy was trapped in deflationary stagflation, during which time, plan after plan failed to re-inflate the economy. During this same period, the People’s Republic of China was in the process of transitioning from a communist agrarian economy to a more global free market industrial economy with great success. Other countries in the region benefited from the commodity demand generated; Australia, India, Korea, Taiwan, Singapore, India and New Zealand, to name a few. Indeed, Japan still plays a leading role on the Asia Pacific stage, but is no longer the sole regional super-economy. In our present time the Asia-Pacific region has developed into an astonishingly productive and efficient contributor to the entire global economy, with several regional trillion dollar economies. So the question becomes, how well do the Asian Pacific funds perform when Japan is removed from the equation? First, using the Seeking Alpha ETF Hub, and filtering Global/Intl Equities by positive one-year performance results with several ‘ex-Japan’ funds. Excluding ‘specialized’ funds, like ‘Ultras’, ‘Small Cap’, ‘Enhanced’ and the like leaves a few plain vanilla, Asia ex-Japan funds summarized in the table below. ( Data from respective fund websites ) In this category, the Deutsche X-Tracker MSCI Asia Pacific ex Japan Hedged EquityETF ( DBAP ) , as the name suggests includes Asia Pacific economies, excluding Japan. Although hedged, this does not entirely eliminate currency risk, but will dampen currency volatility. (Data from X-Trackers) The fund is most heavily weighted in Financials, 30%, followed by Information Technology, 25%; Industrials, 6%; Materials, 5%; Telecom Services, 4%; Consumer Discretionary, 5%; Consumer Staples, 4%; Energy, 4%; Utilities, 3% and Healthcare at 13%. (Data from X-Trackers) It’s also interesting to note the heaviest sector weightings by country. Australia has the heaviest weightings in Consumer Staples, Financials, Health Care and Materials. China holds the heaviest weightings in Energy, Industrials, Telecom, and Utilities. Hong Kong leads the way in Consumer Discretionary and Korea weights most in the IT sector. This is important to note. China and Australia are major trade partners. Slowing demand in China means a slower Australian economy. Australia has its heaviest weightings are mostly defensive with just one very cyclical sector, Materials. (Data from X-Trackers) At this point, a few words need to be said for the trade dynamic in the region. Japan’s major export partners in the region are China, South Korea, Thailand, Hong Kong, Indonesia, Australia, Singapore and Malaysia. Top export products include Cars, Vehicle Parts, Industrial Printers, Specialized Machinery, Construction Equipment and numerous other industrial products. Hence, by omitting Japan, a major industrial manufacturer, supplier and regional economic contributor, that is to say, a potential major contributor to the fund’s performance is omitted. Excluding the Asia-Pacific region, Japan’s second largest import partner is the United States. Even a slow US economy will conduct sizable trade with Japan, particularly in durable goods. Hence, by omitting Japanese industry from the fund, a major factor is omitted. (It should be noted that other non-Asia-Pacific top export partners include Germany, Mexico, Russia, Canada and the U.K.). (click to enlarge) (Data from OEC) Japan is an integral part of the Asia-Pacific region. Even if the Japanese economy is excluded, its presence implicitly impacts the region, hence the fund, to some extent. China, Australia, Singapore, Hong Kong, New Zealand, South Korea and Indonesia, are developed or recently emerged economies. So excluding Japan does not make this an ’emerging market’ fund, nor can it be really be considered a ‘regional economy’ fund without Japan. The fund seems to be structured on the premise that Japan is the leading economy in the region, whose metrics overwhelm the other regional economies. However, by any measure, Japan fits right in with the locals. The point being is that when compared to its regional neighbors, there is nothing overly exceptional nor detracting about the Japanese economy which dominates the region, necessitating its exclusion. (click to enlarge) The fund trades in a rather strong premium to NAV range: mostly 0.5% to 1.0% and at times as much as 1.5% to 2.0% of NAV, rarely trading at a discount to NAV. Also, management fees are slightly on the high side with a net expense ratio of 0.60%. The fund has been trading since October of 2013. Naturally, before making any investment, it’s always worth reading the fund’s prospectus . Disclosure: I/we have no positions in any stocks mentioned, and no plans to initiate any positions within the next 72 hours. (More…) I wrote this article myself, and it expresses my own opinions. I am not receiving compensation for it (other than from Seeking Alpha). I have no business relationship with any company whose stock is mentioned in this article. Additional disclosure: “CFDs, spread betting and FX can result in losses exceeding your initial deposit. They are not suitable for everyone, so please ensure you understand the risks. Seek independent financial advice if necessary. Nothing in this article should be considered a personal recommendation. It does not account for your personal circumstances or appetite for risk.”