Tag Archives: etf-hub-raquo

Beyond India: Look At These Overlooked Broad Emerging Market ETFs

For the past one year, India has been dominating the broad emerging markets, thanks to the enormous ascent of its stock market on pro-growth political hopes, declining inflation – which was once a botheration for the economy – and the latest interest rate cut to spur growth. While its supremacy is still prevalent in the emerging market space, one might be concerned about the overvaluation issues associated with the Indian stocks and the related ETFs. Presently, the biggest and broader emerging market ETF – the Vanguard FTSE Emerging Markets ETF (NYSEARCA: VWO ) and the broader U.S. market SPDR S&P 500 Trust ETF (NYSEARCA: SPY ) sport a P/E (TTM) of 12 and 17 times, respectively, while iShares MSCI India Index ETF (BATS: INDA ) has a P/E (TTM) of 19 times. Secondly, a drastic slump in oil price played its role in facilitating the India ETFs’ upward journey. This was because the country imports more than 75% of its oil requirements. With global oil prices falling about 50% in the last six months, Indian foreign reserves found real reasons to cheer about. However, it remains to be seen how the Indian economy handles the situation when the oil price bottoms and reverses the trend. Also, some analysts believe that the not-so-enthusiastic December 2014 corporate results, a later-than-expected rebound in the investment cycle and overvaluation with respect to the future profit growth potential might stress out the Indian market. Given this situation, some cautious investors might begin to reconsider their emerging market investments and look for broader exposure, rather than sticking to any particular nation. After all, the emerging market space should continue to enjoy cheap money inflows, thanks to QE starting in the eurozone and the easy money policy in most developed nations, despite the likely beginning of policy tightening in the U.S. this year. In light of this, we have highlighted four overlooked ETFs that are tracking emerging markets from around the world (See all emerging market equities ETFs here ). Market Vectors MSCI Emerging Markets Quality ETF (NYSEARCA: QEM ) This fund has attracted $5.3 million in AUM. It charges a 50 bps fee per year, and trades in a paltry volume of around 1,500 shares a day, ensuring additional cost in the form of a wide bid/ask spread. The product tracks the MSCI Emerging Markets Quality Index, and holds 201 stocks in its basket (Read: QEM: A Higher Quality Emerging Market ETF? ). The ETF is slightly tilted toward the top four firms – China Mobile, Tencent Holdings, Taiwan Semiconductor and Samsung Electronics – that collectively make up for more than 20% of total assets. Other firms hold not more than 3.01% share, suggesting modest diversification across each security. The holding pattern reflects the fund’s focus on Asian countries like China (20.7%), India (13%), Taiwan (13.0%), South Korea (12%) and South Africa (11.1%), which take the top five country spots. In terms of sector holdings, Information Technology dominates the portfolio at 34%, followed by Consumer Staples (16.8%), Telecommunication Services (12.6%) and Financials (11.5%). The fund has gained 6.2% since the start of the year (as of February 13, 2015) and more than 8.5% in the last two weeks. The fund yields 2% annually (as of the same date). Behind its decent performance is quality exposure across a number of deserving sectors in the emerging markets and a focus on high-quality criteria like high return on equity, stable year-over-year earnings growth and low financial leverage. The fund trades at a P/E (TTM) of 15 times. iShares MSCI Emerging Markets EMEA Index ETF (NASDAQ: EEME ) This fund has amassed about $8.8 million in assets so far, and trades in volumes of 2,000 shares a day, resulting in additional cost in the form of a wide bid/ask spread over and above the expense ratio of 49 bps a year. The fund is tilted toward South Africa (46.2%), Russia (20.9%), while the third country, Turkey, gets a meager allocation of 9.64%. As far as sectoral diversification is concerned, Financials gets about 34% of the basket, followed by Energy (16.6%) and Consumer Discretionary (14.8%). The latest cease-fire between Ukraine and Russia and the record rally in the South African stocks led the fund way higher. The fund has gained 4.2% so far this year (as of February 13, 2015) and about 6.6% in the last two weeks. The fund yields 3.1% annually (as of February 13, 2015). It trades at a P/E (TTM) of 10 times. ALPS Emerging Sector Dividend Dogs ETF (NYSEARCA: EDOG ) The product tracks the S-Network Emerging Sector Dividend Dogs Index, which gives exposure to a basket of large-cap and high-yield stocks domiciled in the emerging markets. The index takes up an equal-weighted approach to assign weights to securities (Read: ALPS Debuts Dividend ETF in Emerging Market Space ). The index applies the “Dogs of the Dow” theory in the stock selection process. The product looks to hold about 50 stocks with this approach. The ETF offers a solid level of diversification, as both sector and country exposure is limited to five securities. Russia (11.2%), South Africa (10.4%), Brazil (10.3%), China (10%) and Thailand (9.65%) are some of the nations that the fund puts heavy weight on. EDOG has generated about $11.3 million in assets, and trades in 10,000 shares a day. It charges 60 bps in fees. The fund is up 6% in the YTD frame (as of February 13, 2015), while it yields 3.2%. The need for higher yield should be the key to the fund’s future success. EGShares Emerging Markets Domestic Demand ETF (NYSEARCA: EMDD ) EMDD seeks to tap the exponentially rising domestic demand of the emerging market space. The fund puts heavy weight on South Africa (20.2%), China (19.2%), Mexico (16%) and India (11.1%). It has an asset base of $35 million, and trades in volumes of more than 5,000 shares a day. The fund charges 85 bps in fees. Holding about 50 stocks in its portfolio, the fund does not put more than 5.37% assets in one stock. EMDD was up 5% so far this year, and has added about 3.5% in the last two weeks. The P/E (TTM) of the fund stands at 17 times.
10 Reasons Why UTG Is Worth A Look

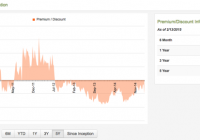
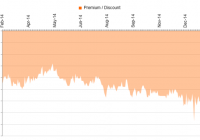
In a world of low-cost indexed ETFs, actively managed closed-end funds are largely unknown to most retail investors. Reaves Utility Income Fund offers an attractive proposition for those seeing to buy-and-hold over the long term. In this article, I present my top ten reasons to consider UTG for your income or DGI portfolio. Reaves Utility Income Fund (NYSEMKT: UTG ) is an actively managed closed-end fund that invests in utilities. The fund currently sports a hefty baseline expense ratio of 1.16%. Study after statistically-based study has shown that active funds with high expense ratios should be avoided ( Vanguard on indexing , Vanguard on expenses , ZeroHedge ). So why in the world would I be recommending that enterprising investors seeking income consider a long-term investment in UTG? I’ll give you ten reasons! Reason One: UTG’s yield is nearly triple the 10-Year Treasury’s. As of 2/17/2015, UTG yields 5.87% while the 10-year treasury yields 2.02%. The rate is also 250 basis points above the Utilities Select Sector SPDR ETF (NYSEARCA: XLU ) yield of 3.34%. The global demand for secure income has bid up the price of nearly every defensive asset class, whether it be bonds, income equities, or alternative assets. Not too many set-it-and-forget-it holdings can offer UTG’s level of income. Reason Two: UTG is abnormally cheap. Closed-end funds trade based on supply and demand. As such, the Market Price of a closed-end fund is always either at a premium or at a discount to Net Asset Value. The fund’s premium/discount as of 2/17/2015 closing is -5.24%. The first benefit of such a discount is an enhanced yield. At par, UTG yields 29 basis points less. The second and more exciting benefit is an improved risk-reward prospect. UTG’s discount is currently more attractive than its 6-month, 1-year, 3-year, and 5-year average discounts. On 2/4/2015, UTG closed at a premium/discount of -1.15%, indicating recent selling beyond Net Asset Value may have been overdone. One might expect premium/discount to trend back towards its historical averages, making you money in the process. (click to enlarge) (Source: CEF Connect UTG Pricing Information ) Reason Three: UTG has a track record of outperformance. Assuming reinvested dividends, on both a Net Asset Value or a Market Price basis… On a one-year, three-year, or five-year time frame… Compared to the S&P Utilities Index or the Dow Jones Utility Average… UTG wins. (Source: UTG’s 2014 Annual Report , dated 10/31/2014) Reason Four: UTG pays dividends every month. That means UTG compounds more quickly than a quarterly or annual dividend payer. When you account for monthly compounding, UTG’s current 5.87% yield is actually above 6% annualized . Over a generation, this sliver of added value can mean serious money. Reason Five: UTG utilizes healthy heaping of leverage. A closed-end fund’s asset base is fixed. Price is based on supply and demand rather than on fund inflows and outflows. Investors can’t panic sell and force the fund to sell holdings. Banks use this secure asset base as collateral to issue debt to UTG, creating leverage. UTG employs a fixed amount of leverage that is irrespective of its Net Asset Value growth. As the fund’s NAV has increased yearly, the percent leverage has decreased. According to CEF Connect , 23.4% of UTG’s NAV is leverage. When I say healthy , there are basically two negatives of leverage. First, leverage increases volatility compared to a similar unlevered investment. Secondly, leverage costs money, since the underwriting bank needs to make a profit. In my humble opinion, I avoid leverage over 33% or an interest expense over 1%. Reason Six: UTG’s distribution is safe. UTG’s dividends are primarily sourced from ordinary income. In 2014, ordinary income made up 90% of UTG’s dividend payments. To account for the remainder, UTG taps into capital gains. (UTG, like many closed-end funds, has a special exception to Section 19(b)(1) of the Securities Exchange Act of 1934 allowing distributions to be paid from capital gains.) Please kindly note the size of the Unrealized Appreciation account in the figure below: $366 million. Compare that with the $47 million that UTG paid in 2014 dividends. UTG could fund distributions for years with just unrealized gains, although I’d probably be long gone if they tried pulling that stunt. Compare this to other closed-end funds with 30% or more sourced from the dreaded Return of Capital and with continually-eroding Net Asset Values. (Source: UTG’s 2014 Annual Report , dated 10/31/2014) Reason Seven: UTG’s distribution is likely to grow. The fund has a strong track record of dividend increases. In the fund’s eleven-year history, UTG has increased its regular monthly dividend eight times. The most recent increase of 10% occurred in December 2014, which followed a 4.8% increase the year prior. Many of UTG’s holdings are habitually growing their dividends, which bodes well for the fund’s long-term prospects. Reason Eight: UTG diversifies the definition of utilities. UTG buys utility-like assets with high barriers to entry across a multitude of industries: renewable energy, oil pipelines, energy infrastructure, railroads, water, and real estate. But what really got me was their willingness to include the likes of Vodafone (NASDAQ: VOD ), Time Warner Cable (NYSE: TWC ), American Tower (NYSE: AMT ), and Annaly Capital (NYSE: NLY ). (Source: UTG’s 2014 Annual Report , dated 10/31/2014) Reason Nine: UTG’s management believes in long-term investing. The annual portfolio turnover ratio over the last five years has been 26%, 30%, 27%, 34%, and 53%. This level of commitment of the fund to its holdings is a strong signal of confidence, and allows the company to focus on of five- and ten-year trends rather than on quarterly noise. (Source: UTG’s 2014 Annual Report , dated 10/31/2014) Reason Ten: UTG is naturally hedged to currency risk. According to its 2014 report, 88% of its assets are invested in the U.S. By keeping a large majority of its assets and liabilities denominated in U.S. dollars, UTG can avoid variable earnings and costly hedging strategies. UTG won’t miss a dividend payment due to a swing in the Swiss franc or Russian ruble. Bonus Reason Eleven: UTG has been vetted by smart money. Bill Gross recommended UTG in the 2010 , 2012 , and 2014 Barron’s Roundtables. Guggenheim Investments holds UTG as a core position in its Infrastructure & MLP CEF Mutual Fund . Finally, Morgan Stanley, Bank of America, and Wells Fargo collectively own 871,000 shares of UTG, or roughly 3% of the float. Conclusion: Enterprising retail investors seeking consistent income should strongly consider Reaves Utility Income Fund. UTG has posted impressive total return numbers over the long haul. And for what it lacks by being a boring utility fund, UTG makes up for it with a fat monthly dividend that will make you smile. Disclosure: The author is long UTG. (More…) The author wrote this article themselves, and it expresses their own opinions. The author is not receiving compensation for it. The author has no business relationship with any company whose stock is mentioned in this article. Additional disclosure: All figures in this article may contain calculation, typo, and other errors. Also, everybody has a unique investment style: different people panic sell at different losses and experience the pleasure of gains differently. Please take responsibility for your investments and perform your own necessary due diligence. Or just buy the S&P and sleep easy.

Managed High Yield Plus Fund: A 9% Yield And A 12.5% Discount Is Hard To Resist

Investors are showing renewed interest in high-yielding junk bonds. With yields of government bonds near record lows, high yield bonds look increasingly attractive. Concerns about exposure to the energy sector appear overblown, especially as oil is now rebounding. Closed end funds offer some of the highest yields and still trade at significant discounts to net asset value. The Managed High Yield Plus Fund offers a rare combination of high yields and professional management, while trading at a major discount to net asset value. Managed High Yield Plus Fund (NYSE: HYF ) is a closed end fund or “CEF” that is professionally managed by UBS (NYSE: UBS ). It primarily invests in high yield bonds and offers a generous yield of nearly 9%. Besides the high yield, there are a couple of other compelling factors, including the fact that this fund pays the dividend on a monthly basis and it is trading at a historically wide discount of about 12.5%, to net asset value. The dividend also appears secure since this fund is earning more each month than it pays out. Let’s take a closer look: (click to enlarge) As the chart above shows, this closed end fund is currently trading for an exceptionally large discount to net asset value and one that is historically wide. The 3-year average discount to net asset value has been 5.78% and the 5-year average has been less than 2%. With the discount now at nearly 12.5%, this appears to be an exceptional buying opportunity. As of February 14, 2015, the net asset value is $2.18 per share and yet these shares are trading for just $1.91 per share. It’s worth noting that this fund has average earnings per share of about 1.37 cents per month, which clearly more than covers the monthly dividend it pays. That is important because it shows that the dividend is secure, and this reduces potential downside risks for investors. To see this and other information, you can see this fund data . This fund has around 359 holdings, which shows it is well-diversified. This diversification reduces potential downside risks for investors. Another consideration for bond investors is duration risk, however, this fund has an average maturity of just about 5.6 years, which means duration risks are low. This fund’s annual expense ratio of just 1.64%, which is low compared to many closed end funds. This fund pays a 1.35 cent per share dividend each month and the next payment is coming up soon. The dividend is payable on February 27th to shareholders of record as of February 19, 2015. The ex-dividend date is February 17, 2015. (click to enlarge) The SPDR Barclays High Yield Bond Fund (NYSEARCA: JNK ) is a popular way for investors to buy high yield bonds. As the chart above shows, junk bonds experienced a decline in mid-December over concerns that some energy companies could be more likely to default due to the plunge in oil prices. These concerns now appear overblown and oil has recently been trending higher. A Financial Times article points out that nearly $3 billion flowed into junk bond funds during the week of February 11, 2015 and this trend could be poised to continue, as the European Central Bank’s new bond buying program is creating more demand for high yield assets. A recent Bloomberg article details why investors are pouring back into junk bond funds, and that concerns over the plunge in oil are diminishing, it states : “Junk bonds are benefiting from demand for higher-yielding assets as the European Central Bank’s new round of bond purchases pushes yields on more than $1.7 trillion of debt worldwide below zero. The resurgence is sending down borrowing costs for speculative-grade borrowers and reopening a new-issue market that all but shut at the end of the year as oil tumbled below $45 a barrel from more than $107 in June. A rebound in crude has also boosted risk appetite. “With rates getting so low, you look at high-yield and it doesn’t look so bad,” Jack Flaherty, a money manager at New York-based GAM USA Inc., which oversees $17 billion, said in a telephone interview. “That has brought investors back in after the volatility at the end of last year scared them away. The fears from weak oil, while not gone, have lessened.” For all the reasons mentioned above, it makes sense to consider this fund if you are seeking generous yields, a monthly payout that is well-covered by current earnings, and professional management. The discount of nearly 12.5% to net asset value is an added bonus because if the discount narrows back to more historical levels, investors could also be positioned for significant capital gains. Here are some key points for the Managed High Yield Plus Fund, Inc.: Current share price: $1.92 The 52 week range is $1.75 to $2.19 Annual dividend: 16 cents per share (or 1.35 cents per month), which yields about 9% Data is sourced from Yahoo Finance. No guarantees or representations are made. Hawkinvest is not a registered investment advisor and does not provide specific investment advice. The information is for informational purposes only. You should always consult a financial advisor. Disclosure: The author is long HYF. (More…) The author wrote this article themselves, and it expresses their own opinions. The author is not receiving compensation for it (other than from Seeking Alpha). The author has no business relationship with any company whose stock is mentioned in this article.