Tag Archives: electric-utilities

Dominion Resources: A Little Patience May Go A Long Way

Summary Dominion Resources has been discussed for its strong fundamentals and various initiatives underway to drive future growth. The data supports that view: book value, earnings, cash and revenue have all grown slowly but steadily in the past and likely will continue growth going forward. However, shares are currently at a premium; investors might be well-advised to wait for a more favorable entry point. There were opportunities before – there likely will be again. Introduction An insightful contributor to SA recently wrote about the strong business fundamentals and growth prospects of Dominion Resources, Inc. (NYSE: D ). The author did a thorough job describing the various initiatives which may drive growth in the future and offered the opinion that the current premium pricing is justified. While the growth initiatives have been well documented, it seems appropriate to more fully explore the current price-to-value relationship of this company. At the current price of about $70, are shares fairly valued? If not, are they priced at a premium right now, or a discount? This article seeks to contribute to the Dominion conversation by exploring a valuation methodology for consideration. The analysis is presented in two-steps: 1) A review of company fundamental metric performance, and 2) a PE valuation calculation. The idea is to assess a company’s historical performance as a guideline for possible future results. The assumption is that solid fundamentals lend themselves to relative predictability over longer periods of time. Then, for high-quality companies with strong track records, over time pricing matches valuation. So the question at hand is to assess the pricing-to-valuation situation right now for Dominion. Step 1: Dominion Resources, Inc. – Historical Trends in Fundamental Metrics In order to assess fundamental performance, it is reasonable to review trends in book value per share, earnings per share, cash flow per share and revenue per share. Book Value Per Share Like always, F.A.S.T. Graphs provides a useful visual. As shown on the graphic below, D has delivered slow and steady balance sheet growth over the period studied. (click to enlarge) source: www.fastgraphs.com Earnings Per Share In my opinion, D has delivered fairly modest earnings per share growth over time. Single-digit growth, while growth, is nothing extraordinary. The graph below indicates this trend is solid, but certainly not spectacular. (click to enlarge) source: www.fastgraphs.com Cash Flow Per Share From my perspective, the data suggests that Dominion management has done an effective job managing cash successfully over long periods of time. Substantial capital investments have increased the earnings capabilities of the company as evidenced by the data. (click to enlarge) source: www.fastgraphs.com Revenue Per Share IMHO, the data again suggests modest revenue growth over periods of time. This seems to suggest a solid position in the market place, but nothing exceptionally over and above the peer group to suggest premium pricing. (click to enlarge) source: fastgraphs.com Based on a review of the data, in my opinion Dominion is a quality company with a track record of success and a variety of initiatives to grow earnings going forward. Results are not spectacular; modest would be a better description. The next step is to determine: at current price levels, are D shares fairly valued, at a premium, or a discount? Step 2: A Possible Valuation When valuing a company, I like to compare that company against its own historical valuation. As usual, F.A.S.T. Graphs comes in very handy. In the chart below, the orange line represents earnings history and what could be considered “fair valuation” at a price/earnings multiple of 15X. The blue line represents a historic normalized average P/E. Finally, the black line is the market price of D. Looking carefully at the graphic below, we can observe that the historical normal PE for D is 15.8X earnings. Today D is priced at 19.5X earnings or more. This is portrayed by the black price line currently above the blue and orange line. (click to enlarge) source: fastgraphs.com So it appears that shares are priced at a premium right now. Just how much of a premium? To purchase D today an investor would be paying nearly 20X earnings when the norm is for an investor to pay 15.8X earnings. And it is noticeable that PE multiples have been growing steadily for this company for that past 5+ years. We can also note there were times in 2011, 2012 and 2013 where this company was available for 15-17X earnings if a person was patient and willing to buy at price levels below the average PE. So what might be a reasonable target entry point? If we apply the average PE multiple to 2015 estimated EPS, an entry point around $58 seems to offer a margin of safety. This may be especially important in a skittish market overall. IMHO, even though the company has a number of initiatives underway, there is downside risk when paying at prices above historical valuation norms. Over time the price tends to revert to the average valuations. In this case, buying above the average may present downside risk. Conclusion This article was intended to add to the conversation by looking at trended financial fundamentals and a closer look at valuation. IMHO, Dominion is a quality company with initiatives and investments under way to generate future earnings growth. However, at current price levels shares are priced at a premium. Investors may be well-served to be patient and wait for pullbacks to at least normal PE levels, or perhaps consider selling puts as a way to enter a position at an even better entry point. As always, all of the above opinions offered for your consideration as you make your own investment decisions. Commentary is intended simply as a contribution to the discussion only. Thank you very much for reading. Disclosure: I/we have no positions in any stocks mentioned, and no plans to initiate any positions within the next 72 hours. (More…) I wrote this article myself, and it expresses my own opinions. I am not receiving compensation for it (other than from Seeking Alpha). I have no business relationship with any company whose stock is mentioned in this article.
Otter Tail Corporation: Unofficially Nudging Forward

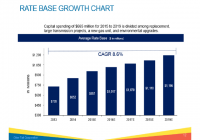
Otter Tail Corporation reported 2015 second quarter results on August 3rd. Based on its performance, the company unofficially increased its full-year EPS projection. Six months in, the company’s potential to cover both its annual dividend and corporate costs looks solid. Even considering Otter Tail traditionally pays a dividend exceeding the average of diversified utilities, the company’s share price is not yet out of fair value range. The allure of owning a diversified utility is the blend of a stable, healthy dividend and the potential of share price appreciation. Otter Tail Corporation (NASDAQ: OTTR ) operates as an electric utility in northern states in the Midwest and as a manufacturer of plastics, PVC pipe and metal fabrication. The company reported second quarter results on August 3rd. After a first quarter reset 9% to 10% downward of full-year estimates, the company unofficially raised full-year estimates in its second quarter reporting. The overall effect is still a decrease from the company’s original guidance. But, the bump now represents improvement over 2014 results which can be extrapolated into safety of the dividend and potential for share price improvement. Otter Tail’s first quarter results were mixed in its manufacturing segment, Varistar. The segment was unexpectedly tripped up by the downturn in the oil and gas industry. The second quarter performance still showed some impact but the company was better able to manage the challenges. The loss of sales to manufacturers of oil and gas equipment was partially offset by sales to manufacturers of lawn and garden equipment, recreational equipment and wind energy equipment. Year-over-year, the segment’s revenue in the quarter decreased 4%. On the bottom line, the segment’s operating income increased 8.6% year-over-year. The primary contributor to the difference was lower resin prices. Otter Tail sold more pounds of PVC pipe at lower prices but it cost the company much less to do so. Relative to its core business of being an electric utility, the company’s performance was favorable in the second quarter. The weather is, obviously, beyond the company’s control. To date, 2015 has offered milder seasons. In the 2014 second quarter, compared to “normal”, both the heating degree days and cooling degree days exceeded 100%. By comparison, in 2015, the heating degree days registered only 82.7% of normal and cooling degree days registered 78.9% of normal. Sales in the quarter were lower to both retail and wholesale customers. This loss was offset by ECR (environmental cost recovery) rider revenue related to the company’s ACQS (air quality control system) environmental upgrade project and higher transmission tariff revenue from MISO (Midcontinent Independent System Operator) related to increased investment in regional transmission lines. The slide below from the latest investor presentation depicts the regulated rate base capital expenditures for the next 5 years which will drive growth: (click to enlarge) Contributing directly to the segment’s bottom line, the company’s production fuel costs and maintenance expenses were lower in the quarter. Year-over-year, the segment’s operating income and net income increased over 50%. The second quarter delivered $0.36 in EPS from continuing operations, a 71% increase compared to the 2014 second quarter. Year-to-date, the EPS total of $0.73 is still lagging 2014 by 10%. In 2014, full-year EPS was $1.55. Otter Tail’s original guidance for 2015 was a range of $1.65 to $1.80. With the first quarter results, the range was adjusted to $1.50 to $1.65. In the second quarter press release, Otter Tail management stated it “now expects to be in the middle to upper end of the range”. The company did not formally adjust the range. But, the statement unofficially moves the guidance to $1.57 to $1.65. Based on the company’s strategy, the utility segment’s earnings are to support the dividend paid to shareholders. The 2015 EPS projection for the segment is $1.23 to $1.26. The company’s current annual dividend rate is $1.23. The Varistar segment’s earnings are intended to cover corporate costs and drive share price appreciation. The current full-year projection per share for this segment is $0.50 to $0.58. Corporate costs are projected in a range of $0.19 to $0.23 per share. Compared to 2014 where corporate costs totaled $0.22 per share for the full year, the company is currently operating at just 80% of the 2014 rate. An adjustment to full-year EPS warrants an adjustment in a buy point for Otter Tail. Using the unofficial full-year EPS range of $1.57 to $1.65 equates to a midpoint of $1.61. At a dividend rate of $1.23, the payout ratio based on the unofficial midpoint would be less than 80%. Acknowledging Otter Tail, at 4.4%, has consistently paid above the average yield for diversified utilities, any price up to $30.75 maintains a yield of 4%. As well, any price below $30.75 equates to a P/E ratio equal to the average P/E ratio of 19.09 for the Utilities sector. Disclosure: I am/we are long OTTR. (More…) I wrote this article myself, and it expresses my own opinions. I am not receiving compensation for it (other than from Seeking Alpha). I have no business relationship with any company whose stock is mentioned in this article. Additional disclosure: I belong to an investment club that owns shares in OTTR.

Attractive Valuations And Potential To Outperform Peers Are Highlights Of American Electric Power

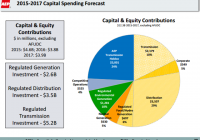
Summary Stock should trade at a 5%-10% premium to its peers’ average forward P/E. Company’s business fundamentals remain strong and efforts to strengthen regulated operations will bode well for stock price. As AEP increases regulated operations, its cash flows will become more certain, which will support dividend growth. American Electric Power (NYSE: AEP ) has strong business fundamentals and its future financial performance is expected to be solid. The stock stays an attractive investment prospect for income-seeking investors, as it offers a solid yield of 3.9% . Moreover, the company’s future growth is expected to stay strong, which will be mainly driven by its capital spending, directed at strengthening and expanding its regulated business operations. The company’s focus on regulated business operations is gaining significant traction, and it expects to achieve long-term growth of 4%-6%. Moreover, an important decision American Electric has to make in the next 3-6 months is regarding the faith of its merchant assets; either the company will sell the assets or continue to operate them. Furthermore, the stock’s current valuations are attractive. Strong Performance and Growth Catalysts American Electric has been delivering a strong financial performance, which is expected to continue in future, mainly driven by its increased focus on regulated operations. The company reported EPS of $0.88 for 2Q2015, beating consensus of $0.81. Also, rate increases and cost control initiatives positively affected American Electric’s performance for the quarter. In 2Q2015, the company secured a $123.5 million annual revenue increase and ROE of 9.75% in West Virginia, along with a $45.4 million annual revenue increase and ROE of 10.25% in Kentucky. Given the strong performance in the first half of 2015, the company increased its mid-point of 2015 EPS guidance by 2%; increased 2015 EPS guidance from $3.4-$3.6 to $3.5-$3.65 . In recent times, the company increased its focus on regulated operations, as the performance of unregulated/merchant operations has stayed weak and volatile because of low forward power prices. The company has a robust capital spending outlook, which will fuel its revenues and earnings growth in future years; American Electric plans to incur capital spending of $12.3 billion from 2015-2017. As the company has increased its focus on strengthening its regulated operations, 96% of the planned capital spending will be allocated to regulated business. Also, the company increased its 2015 capital spending guidance from $4.4 billion to $4.6 billion ; as the company continues to make progress with its cost control measures under its continuous improvement program, it freed up an additional $200 million for capital investment for 2015. The following chart shows the breakdown of the company’s planned capital spending. (click to enlarge) Source: Investors Presentation As forward power prices remain weak and volatile, utility companies in the U.S. are taking initiatives to reduce their merchant power operations. American Electric is also considering different strategic options for its 7,900MW of competitive fleet. I think that in the next 3-6 months, the company will make a decision regarding the future of its merchant assets, as currently it waits for the PJM auction results and for the pending Ohio PPA proposal. I think the best option for the company is to sell its merchant assets, as it will allow it to completely focus on regulated operations, which will improve its revenues and cash flow stability, and will augur well for the stock valuation. Moreover, I believe the company’s merchant assets sale value could range from $2 billion to $3.2 billion, depending on the outcome of the PJM auction prices, which are expected to settle by mid-August. Also, if the company chose to sell its merchant assets, it can direct the sale proceeds to increase its planned capital spending for future years, which will have a positive impact on the stock price. Other than the robust capital spending profile, the company has been making consistent efforts to improve its credit outlook. The company has successfully managed to reduce its total debt to total capitalization ratio from 57% in 2010 to 54.3% in 2Q2015. Also, the company’s qualified pension funding stands at 101% in 2Q2015, up from 96% in 1Q2015 and 97% in 2014, as displayed below in the figures. (click to enlarge) Source: Investors Presentation Valuation and Summation The stock’s current valuation stays attractive, as it is trading at a forward P/E of 15.08x , in contrast to its peers’ average forward P/E of 15.5x. Given, the company’s solid financial performance and robust capital spending profile, which will fuel its future growth, I think the stock should trade at a 5%-10% premium to its peers’ average forward P/E. Also, the company’s business fundamentals remain strong and the company’s efforts to strengthen its regulated operation will bode well for the stock price. And if the company chose to sell its merchant assets, its business risk profile will improve, as revenues and earnings will become more stable. Moreover, as the company is increasing its regulated operations, its cash flows will become more certain, which will support its dividend growth. Disclosure: I/we have no positions in any stocks mentioned, and no plans to initiate any positions within the next 72 hours. (More…) I wrote this article myself, and it expresses my own opinions. I am not receiving compensation for it (other than from Seeking Alpha). I have no business relationship with any company whose stock is mentioned in this article.